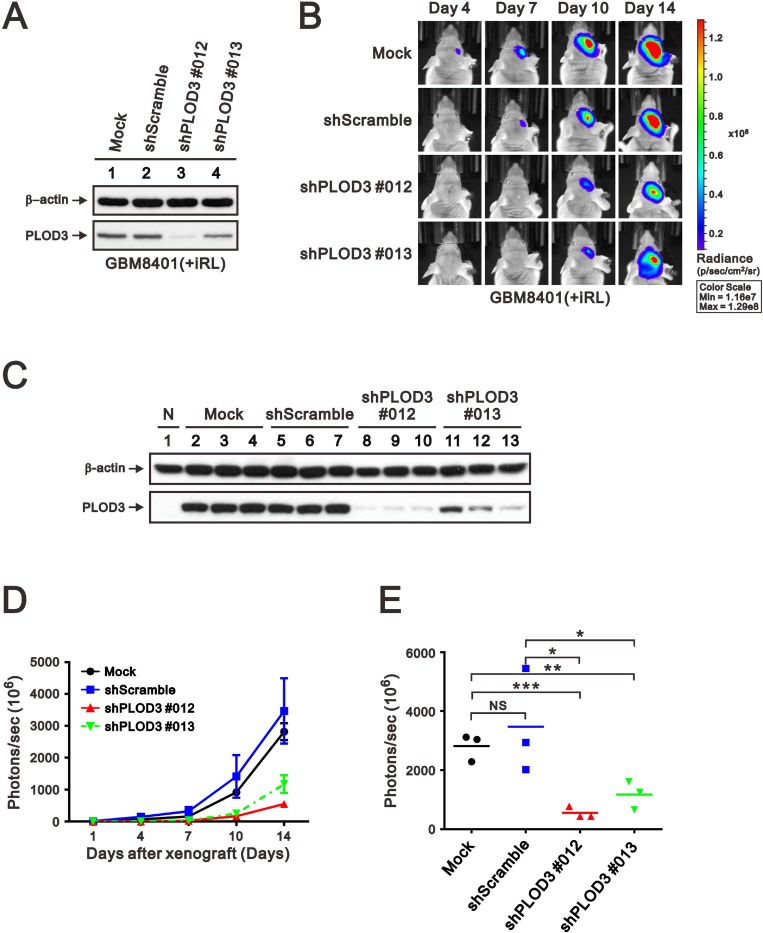
Figure 6. PLOD3 knockdown decreased glioma growth in an orthotopic mouse model.
(A) SDS-PAGE and western blot analysis of GBM8401-iRL cells transfected with shScramble and shPLOD3 RNA were applied to quantitate PLOD3 protein expression. (B) Representative IVIS images of mice (days 4, 7, 10, and 14) after implantation of GBM8401-iRL cells stably transfected with shScramble or shPLOD3 RNA. (C) Western blot analysis was carried out of normal brain, and tumors formed by Mock, shScramble, shPLOD3#012, and shPLOD3#013 GBM8401-iRL cells. Tumor growth curve (D) and quantitative analyses of tumor progression at day 14 (E) based on the total intensity of IVIS imaging. n = 3 for each group; *p < 0.05, **p < 0.01, and ***p < 0.001 compared to the PLOD3 wild-type group.

