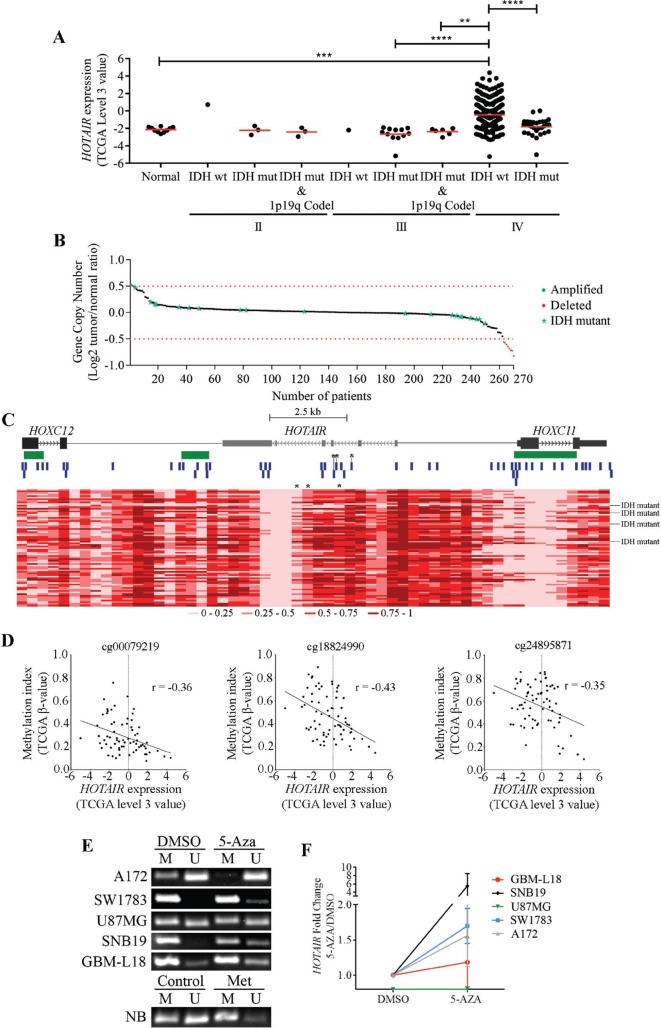
Figure 1. Molecular characterization of HOTAIR in gliomas.
(A) Expression levels of HOTAIR in 424 gliomas, stratified according to WHO grade, IDH and 1p/19q codeletion statuses (1 IDH-wt, 3 IDH-mut, and 3 IDH-mut and 1p/19q codeleted grade II gliomas; 1 IDH-wt, 12 IDH-mut, and 6 IDH-mut and 1p/19q codeleted grade III gliomas; 368 IDH-wt and 30 IDH-mut glioblastomas (GBM); and 10 unmatched normal brains from the TCGA microarray data). HOTAIR is highly expressed (TCGA data “level 3” values ≥ 0) in 34.2% (n = 126) of IDH-wt GBM samples and in 1 IDH-mut GBM (3%) and 1 IDH-wt grade II glioma (100%). (B) HOTAIR gene copy number status in 270 GBMs (250 IDH-wt and 20 IDH-mut) from TCGA. HOTAIR is amplified (Log2 Copy Number Tumor/Normal ≥ 0.5) in 0.8% (n = 2; green dots), and deleted (Log2 Copy Number Tumor/Normal ≤ –0.5) in 3.2% (n = 8; red dots) of IDH-wt GBM samples. Red dashed lines represent the normal copy number interval. (C) Heatmap representations of DNA methylation levels (TCGA β-values) of the chromosomal region encompassing HOTAIR and the 2 closest genes (HOXC12 and HOXC11) in 74 GBMs (70 IDH-wt and 4 IDH-mut) from TCGA. A total of 56 methylation probes (vertical blue bars) were assessed. CpG islands > 300bp are represented in green. *indicate probes whose methylation indexes are significantly inversely correlated with HOTAIR expression levels (probes cg00079219, cg18824990 and cg24895871). The color code (grades of red color corresponding to different methylation indexes) is shown below the heatmap. Each column corresponds to a probe and each row to a patient. (D) Correlation graphs between HOTAIR expression levels (TCGA “level 3” value) and DNA methylation indexes (TCGA β-values) in 70 GBM samples. Only probes whose methylation values are significantly inversely correlated with HOTAIR expression are shown (cg00079219, cg18824990 and cg24895871; marked with *in C). (E–F) Glioma cell lines were treated with 5 µM 5-Aza for 72 hours, upon which promoter methylation status (E) and HOTAIR expression levels (F) were evaluated. 5-Aza treatment promoted HOTAIR promoter demethylation (E) that associated with its increased expression in a cell line-dependent manner (F). qPCR levels were normalized to the expression of HPRT1 and are presented as fold-changes; methylation-specific PCR was controlled by blood DNA (NB) untreated (Control) or in vitro methylated (Met). No detectable HOTAIR expression was found for U87 (untreated or 5-Aza-treated). The results are representative of at least 2 replicates (mean ± SD). *p < 0.05; NB - DNA from normal blood.

