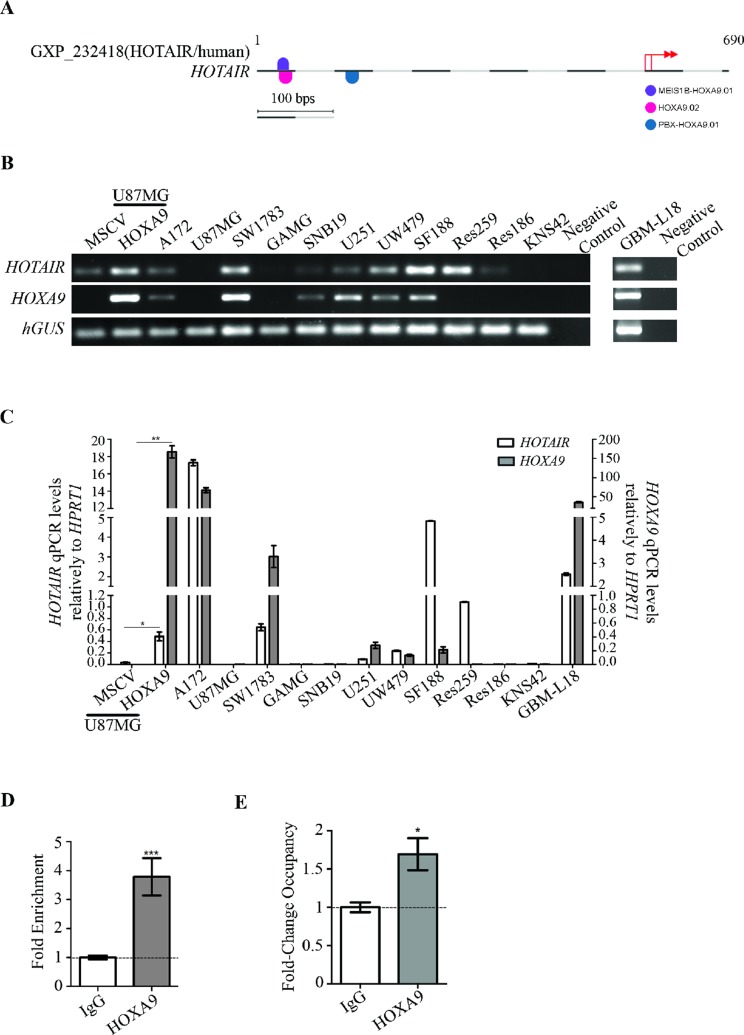
Figure 2. HOXA9 transcriptionally activates HOTAIR via direct interaction with its promoter region.
(A) MatInspector representation of specific binding sites for HOXA9 matrix in HOTAIR promoter region. Each matrix match is represented by a half round symbol and each color symbolizes a matrix family. Pink, blue and violet colors represent the matrixes HOXA9.02 (matrix sim = 0.899, sequence: ctgtgacaTAAAattgg and family ABDB), PBX-HOXA9.01 (matrix sim = 0.849, sequence: gaggTGGTttatgagct and family HOXC) and MEIS1B-HOXA9.01 (matrix sim = 0.837, sequence: TGCCaattttatgtc and family HOXH), respectively. Basepairs in italic appear in a position with a high conservation profile in the matrix (ci-value > 60). Basepairs in capital letters represent the core sequence used by the program. Matches represented on the top of the sequence line were found on the positive strand, while below the sequence line reside matches found on the negative strand. The red arrows represent HOTAIR putative transcription start sites (TSS). (B–C) HOTAIR and HOXA9 expression were evaluated by reverse-transcriptase PCR (B) and quantitative PCR (C) in a panel of adult and pediatric glioma-derived cell lines, and in the GBM-L18 primary GBM-derived cell culture. GBM cell line U87MG-MSCV does not present detectable levels of endogenous HOTAIR expression, which were significantly increased upon retrovirally-mediated HOXA9 overexpression (U87MG-HOXA9). White and grey bars represent HOTAIR and HOXA9 expressions, respectively. qPCR levels were normalized to the expression of HPRT1. The results are representative of triplicates (mean ± SD). *p = 0.029; **p = 0.0088. (D–E) The putative binding of HOXA9 protein to the promoter region of HOTAIR was assessed by chromatin immunoprecipitation (ChIP) analysis followed by quantitative PCR in U251 cells (D), and U87MG-HOXA9 and their HOXA9-negative counterparts (E). IgG was used as negative control for the ChIP. Chromatin immunoprecipitated with an anti-HOXA9 antibody shows direct binding of HOXA9 to the HOTAIR promoter. Relative enrichment is normalized to input DNA (not subjected to immunoprecipitation) and to the IgG background signal (D), whereas fold change occupancy is normalized to input, IgG and HOXA9-negative cells (E), from three independent experiments (mean ± SD). (D) ***p = 0.0002; (E) *p = 0.0148.

