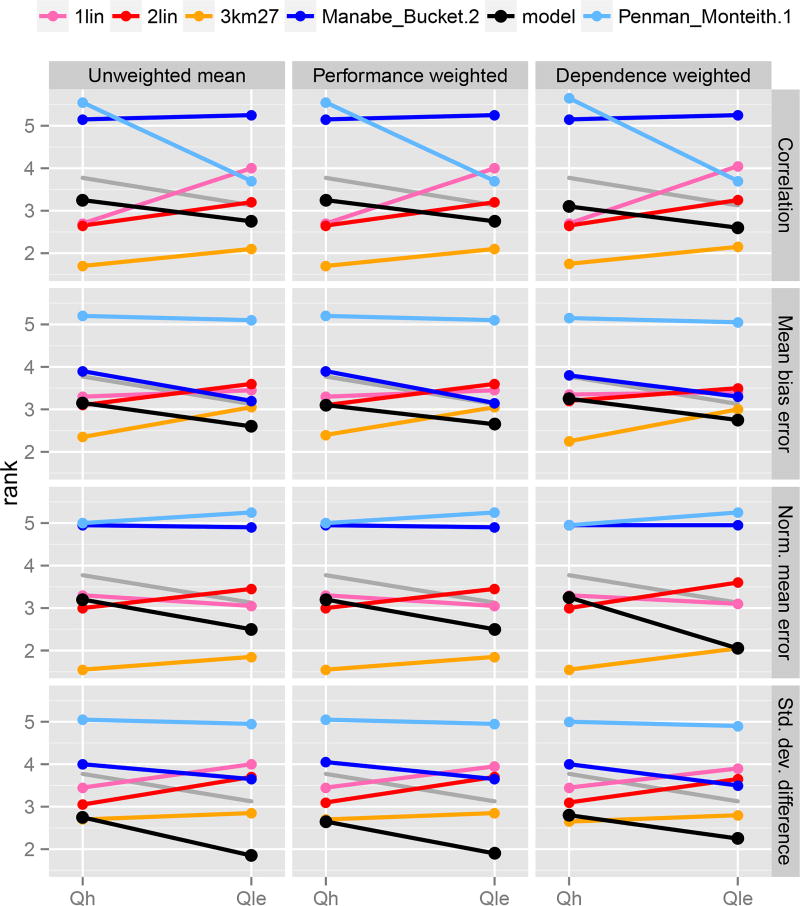
Fig. 12.
As for Figure 2, but showing the results for three different means across all LSMs, by metric. The gray line is identical to that shown in Figure 4. In general, we should expect means to perform better under all metrics except the standard deviation metric, as the averaging process acts as a smoother, removing non-correlated noise from the model results.

