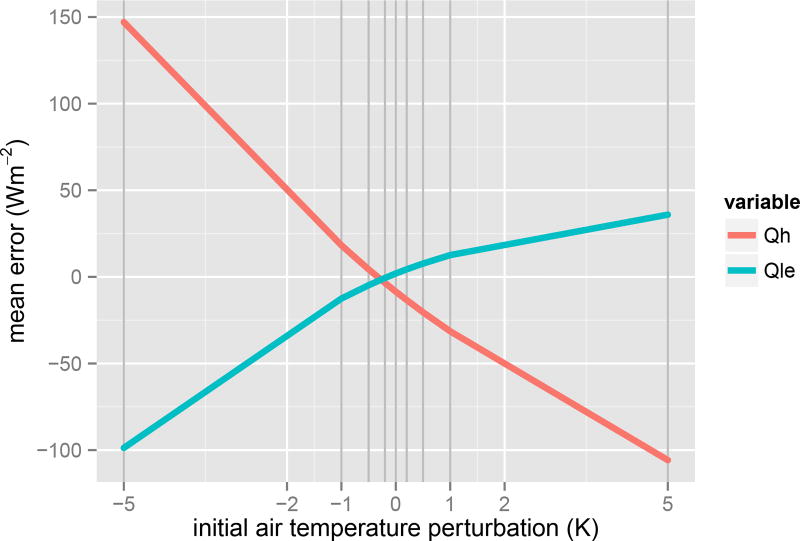
Fig. 13.
Mean error in Qh and Qle as a result of perturbing the initial canopy air temperature at each time step, in CABLE at the Tumbarumba site, in south eastern Australia. Temperature was perturbed by ±(5, 2, 1, 0.5, 0.2)K, and a control run is included. All model parameters were left as default values. The response in Qh to negative temperature perturbations is about 50% stronger than in Qle, and about 3 times stronger for positive perturbations.

