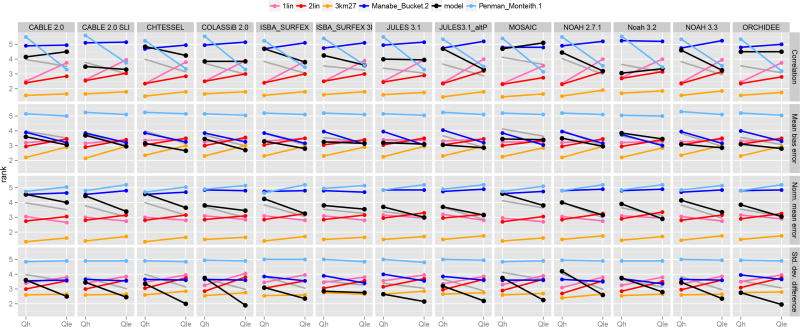
Fig. 4.
As for Figure 2, but each row represents an individual metric (see Table 3 for metric definitions). The gray line shows the original LSM mean rank for comparison (as in Figure 2, though note that these data are only comparable with the black line, and not the benchmarks which have also changed).

