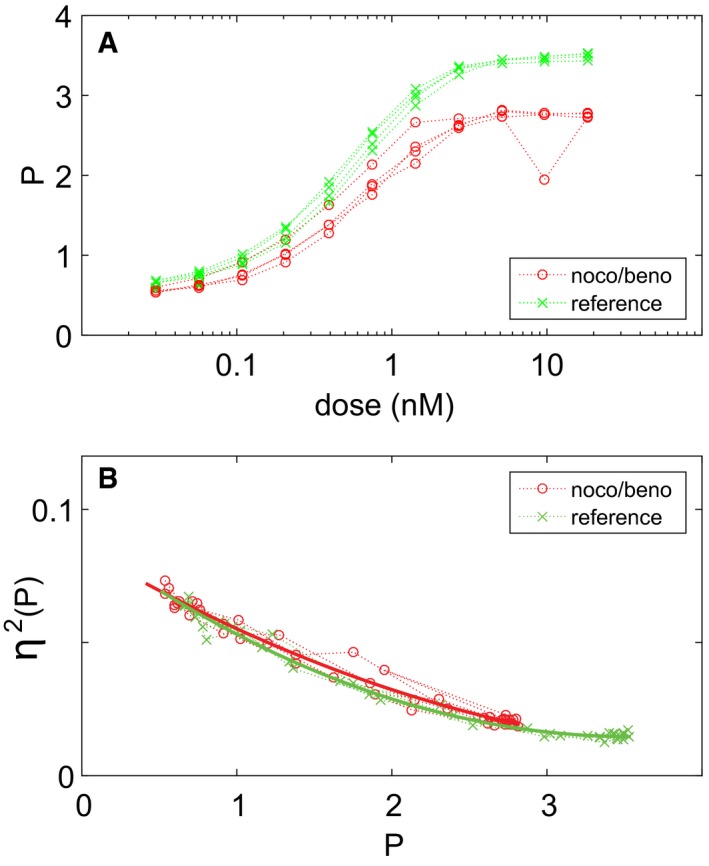
We treated SGA85 cells with nocodazole and benomyl (
Appendix), stimulated PRS activity with the indicated concentrations of pheromone, measured the accumulated fluorescent protein by flow cytometry, and computed η
2(P) and P as detailed in
Materials and Methods.
Plot shows P vs. dose.
Plot shows η2(P) vs. P.
Source data are available online for this figure.

