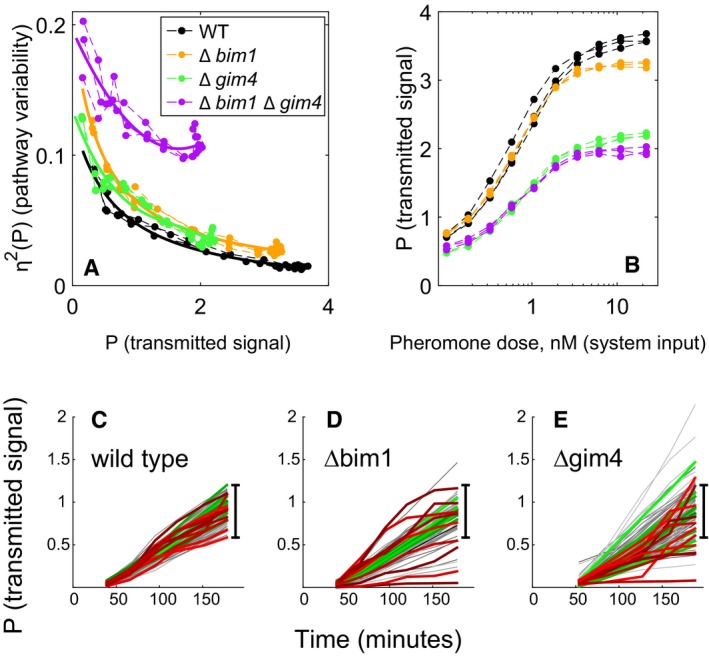
Figure 4. Increased cell‐to‐cell variability and distinct time‐dependent trajectories in Δbim1 and Δgim4 mutants.

-
A, BDeletions of BIM1 and GIM4 in clean genetic background increase signaling variability at all outputs. Data were collected from dose‐response flow cytometry measurements of reference (GPY4000), Δbim1 (GPY4001), Δgim4 (GPY4031), and ∆bim1 ∆gim4 (GPY4036) (bearing the P PRM1 ‐mCherry and P BMH2 ‐YFP reporters) stimulated for 3 h with the indicated pheromone doses. (A) η2(P) as a function of P. Solid curves are best fits of a rational polynomial model to the measurements from each strain. These models tend toward infinity as transmitted signal tends toward zero, where we expect very large relative variability. (B) P as a function of pheromone dose. Data correspond to measurements at different doses measured on the same day (three replicates).
-
C–EAccumulated signal P vs. time in reference and microtubule perturbed cells. Transmitted signal P vs. time in individual cells of the reference (GPY123, “wild type”), Δbim1 (GPY4144) and Δgim4 (GPY4150) strains (N = 103, 102, 118, respectively). We induced the PRS by addition of 20 nM pheromone to the medium and imaged cells every 30 min as previously done (Colman‐Lerner et al, 2005 and Gordon et al, 2007). In all populations, about 5% of the cells did not respond to pheromone induction. Traces correspond to pathway output (inducible P PRM1 ‐mCherry signal/constitutive P ACT1 ‐CFP signal) from individual cells followed over time. For each strain, we colored the 10 most stable trajectories green, and the 10 least stable (crooked) trajectories red. The black bar shows the full range of WT responses, for comparison.
Source data are available online for this figure.
