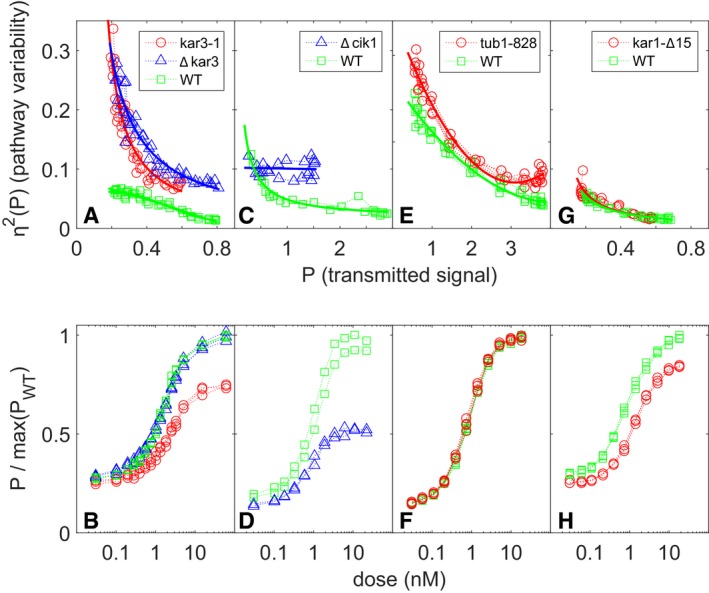
Figure 5. Cell‐to‐cell variability in signal transmission in cells with mutations affecting microtubule end function.

-
A–Hη2(P) vs. P and dose response in: (A, B) kar3‐1 (SGA108, the “rigor mutant”), ∆kar3 (SGA2015), and WT cells (SGA103) (three replicates each); (C, D) ∆cik1 (GPY4123) and WT cells (GPY4000) (two replicates); (E, F) tub1‐828 expressing and WT cells (GPY1858) (four replicates); and (G, H) kar3‐∆15 (SGA109) and WT cells (SGA103) (three replicates). In (A, C, E, G), the x‐axis values are the transmitted signal P. In (B, D, F, H), the y‐axis values are P divided by the maximum value of P observed for the WT strain in each.
Source data are available online for this figure.
