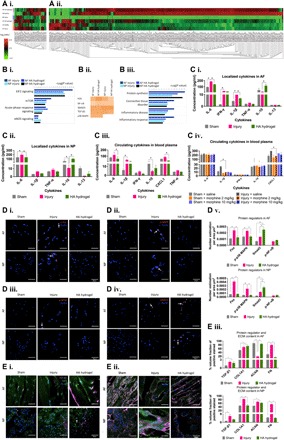
Fig. 5. Proteomic analysis of IVDs.

(A) Proteins were isolated from the ECM by proteinase K digestion (i) and from cells and ECM by trypsin digestion (ii). Differentially expressed proteins are shown in heatmaps of log2-transformed abundance generated by Peak Studio, with red for high expression and green for low expression. (B) IPA of the protein data set from MaxQuant analysis. (i) IPA identified canonical pathways that were likely to be involved in the response to disc injury and to HA hydrogel implantation in AF and NP tissues. (ii) Heatmap of the top upstream regulators involved in modulated cellular functions with a Z score of >1.5. (iii) Disease- and function-related pathways identified by IPA. (C) Cytokine profiling. (i and ii) In AF and NP tissues, the levels of IL-6 and IL-1β (and IFN-γ in AF) were significantly higher (and IL-10 was lower) in the untreated injury group than in the sham control or HA hydrogel–treated injury groups. (iii) In blood plasma, the levels of IL-6, CXCL1, and IL-1β were significantly higher in the untreated injury group than in the sham control or HA hydrogel–treated injury groups. (iv) Levels of IL-6, CXCL1, and IL-1β varied between saline-treated and morphine-treated groups. (D and E) Expression of the regulator proteins: (D, i and v) c-Fos, (D, ii and v) phosphorylated p38 MAPK, (D, iii and v) phosphorylated NF-κB, (D, iv and v) Smad3, (E, i and iii) TGF-β1 and type I collagen, and (E, ii and iii) aggrecan and fibronectin. *P < 0.05, significant differences between the HA-treated injury and untreated injury groups, two-way ANOVA [n = 10 for (C, iv), and n = 5 for (A), (B), (C, i and iii), (D), and (E)]; *P < 0.05, significant differences between the HA-treated injury and untreated injury groups, one-way ANOVA [n = 3 for (D) and (E)]. Data are means ± SEM. Scale bars, 50 μm.
