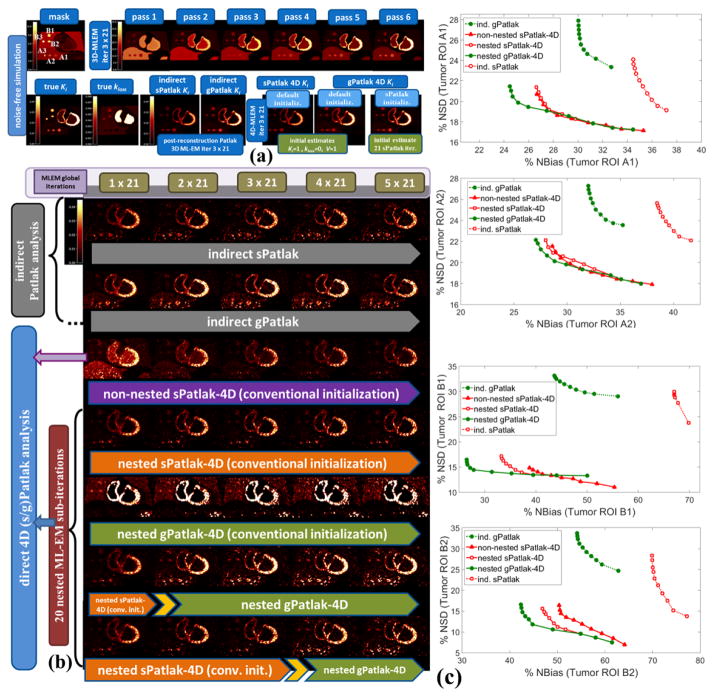
Figure 5.
(a) Overview of noise-free Ki and kloss images and (b) noisy Ki images from simulated 4D PET data employing indirect and direct (s/g)Patlak methods. The orange and green bars denote sPatlak and gPatlak ML-EM global iterations respectively for the images directly above. In the last 2 rows, the yellow arrow position between the two bars designates at which iteration were the gPatlak estimates, on the right, initialized from the sPatlak estimates, on the left. (c): Quantitative Ki noise-bias trade-off analysis on four ROIs across 20 noise realizations. The red and green colors correspond to sPatlak and gPatlak methods, while the continuous and dotted delineations indicate direct and indirect methods, respectively. The triangle markers on red curves denote non-nested sPatlak method. Evaluations were conducted every 21 global ML-EM iterations, each consisting of 20 nested sub-iterations. Thus, gPatlak-4D was initialized after 3×21=63 sPatlak ML-EM iterations.

