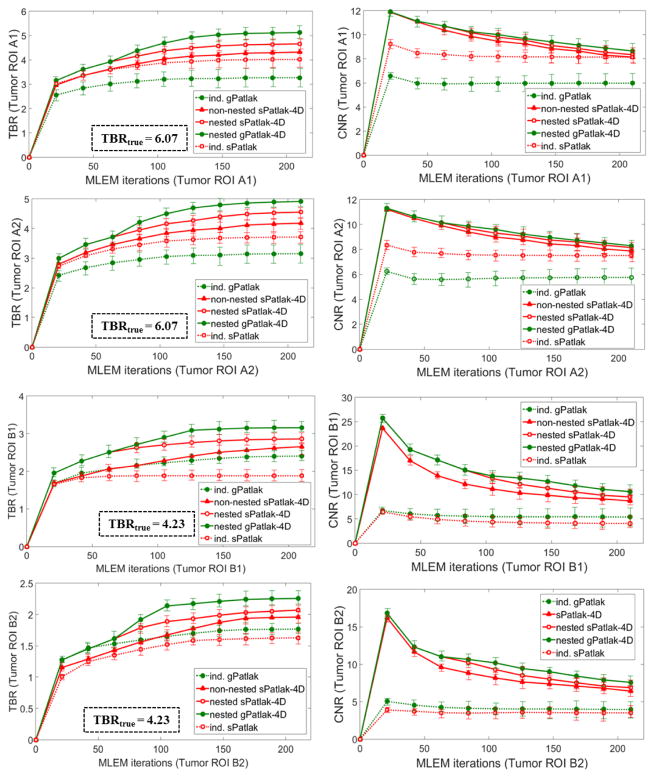
Figure 6.
TBR (1st column) and CNR (2nd column) quantitative analysis for A1, A2, B1 and B2 target ROIs on simulated Ki parametric images for a range of indirect and direct (s/g)Patlak methods. The same number of nested Patlak ML-EM sub-iterations and gPatlak-4D initialization scheme are employed, as for figure 5. TBR and CNR scores were averaged over 20 noise realizations with the standard deviation illustrated with error bars.

