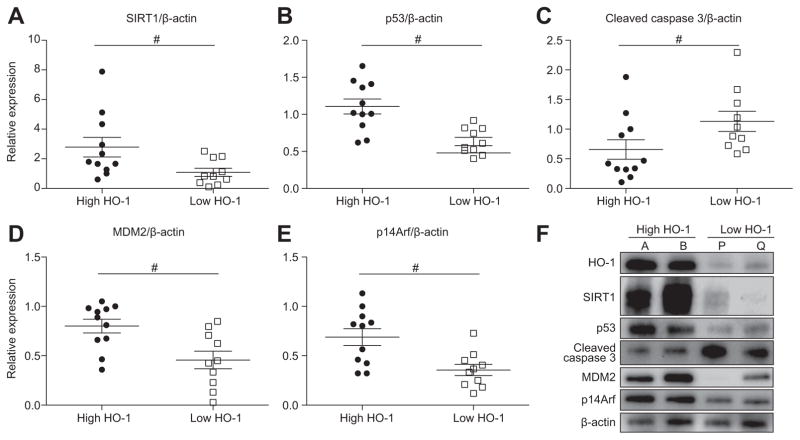
Fig. 2. HO-1 levels in human OLT correlate with SIRT1, p53, cleaved caspase 3, MDM2, and p14Arf levels.
Twenty-one human liver transplant biopsies were divided, based on the relative HO-1 expression, into “high” (n = 11) and “low” (n = 10) groups (Fig. 1A). (A–E) Relative expression of SIRT1 (A; mean: 2.78 vs. 1.09), p53 (B, mean: 1.11 vs. 0.63), cleaved caspase 3 (C; mean: 0.66 vs. 1.13), MDM2 (D; mean: 0.80 vs. 0.46) and p14Arf (E; mean: 0.69 vs. 0.36). Data are shown in dot plots; bars indicate mean ± SEM. #p <0.05 high (n = 11) vs. low (n = 10) HO-1 (Mann-Whitney U test). (F) Representative Western blot-assisted OLT expression of HO-1, SIRT1, p53, cleaved caspase 3, MDM2 and p14Arf (A/B: high HO-1; P/Q: low HO-1).

