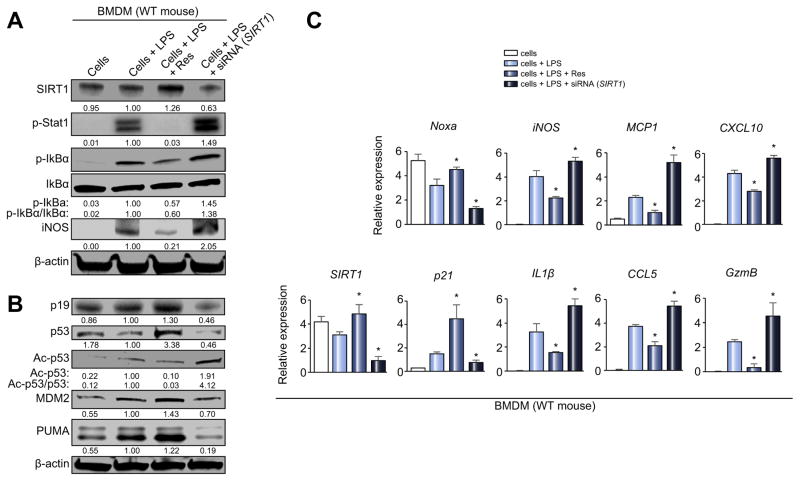
Fig. 5. SIRT1 depresses macrophage activation and upregulates p53 signaling in vitro.
LPS-stimulated BMDM (100 ng/ml, 6 h) with/without Res (SIRT1 inducer, 100 μM, 12 h) or siRNA SIRT1 were screened for activation markers. (A and B) Western blot-assisted detection of SIRT1, p-Stat1 (Tyr701), p-IkBα (Ser32), IkBα, iNOS, p19, p53, Ac-p53 (Lys379), MDM2, and PUMA. Band intensities were quantified with ImageJ and normalized by dividing target band intensity by that of housekeeping β-actin. The values under the bands represent relative ratios of normalized intensity, compared to cells + LPS. Representative of three experiments is shown. (C) Quantitative RT-PCR-assisted detection of mRNA coding for SIRT1, Noxa, p21, iNOS, IL-1β, MCP1, CCL5, CXCL10 and GzmB. Data normalized to B2M gene expression (n = 4/group) are presented as the mean ± SD. *p <0.05 vs. cells + LPS (one-way ANOVA).

