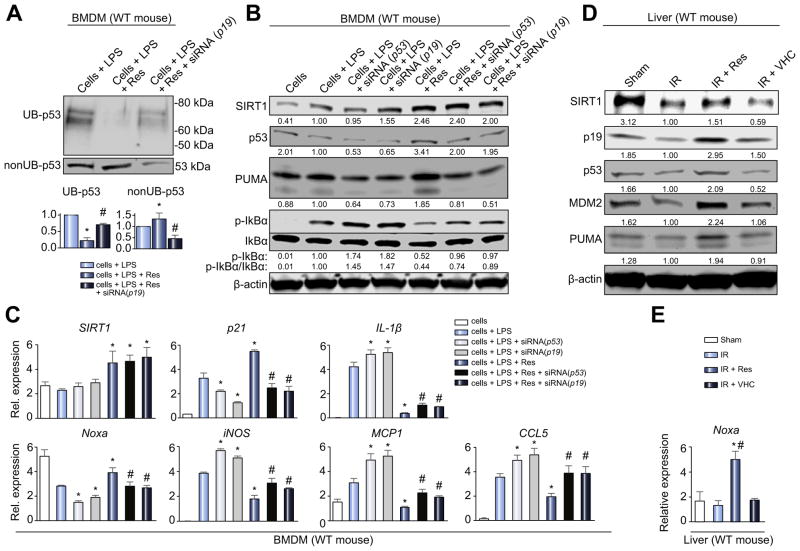
Fig. 6. SIRT1 inhibits macrophage activation through p19/p53 signaling.
(A–C) BMDM stimulated with LPS (100 ng/ml, 6 h) were treated with Res (100 μM, 12 h), siRNA (p53) or siRNA (p19). (A) 25 μg of protein lysate from BMDM were divided by immunoprecipitation into ubiquitinated (UB-) and non-ubiquitinated (nonUB-) proteins and analyzed by Western blotting. Representative images (upper panel) and densitometry quantification (lower panel) are shown. *p <0.05 vs. cells + LPS, #p <0.05 vs. cells + LPS + Res, n = 3/group (one-way ANOVA). (B) Western blot-assisted detection of SIRT1, p53, PUMA, p-IkBα (Ser32) and IkBα in LPS-stimulated BMDM. Band intensities were normalized by dividing target band intensity by that of β-actin. The values under the bands represent relative ratios of normalized intensity compared to that of cells + LPS. Representative of three experiments is shown. (C) Quantitative RT-PCR-assisted detection of mRNA coding for SIRT1, Noxa, p21, iNOS, IL-1β, MCP1 and CCL5. Data were normalized to B2M gene expression (*p <0.05 vs. cells + LPS, #p <0.05 vs. cells + LPS + Res, n = 4/group, one-way ANOVA). (D and E) Livers in WT mice underwent 90 min of warm ischemia followed by 6 h reperfusion. (D) Western blot-assisted detection of SIRT1, p19, p53, MDM2 and PUMA. The values under the bands represent relative ratios of normalized intensity compared to that of IR. Representative of three experiments is shown. (E) Quantitative RT-PCR-assisted detection of mRNA coding for Noxa. Data normalized to HPRT gene expression (*p <0.05 vs. IR, #p <0.05 vs. IR + VHC, n = 4/group, one-way ANOVA) are presented as mean ± SD.

