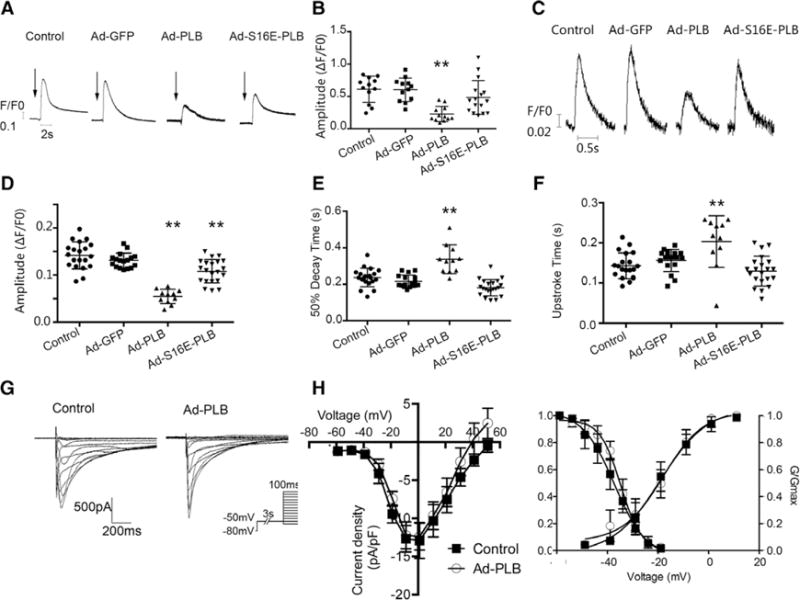
Figure 4.

Effects of adenovirus (Ad)-green fluorescence protein (GFP), Ad-phospholamban (PLB), and Ad-S16E-PLB transduction on the Ca2+ transient properties, SR load, and ICa,L of hES2-ventricular cardiomyocytes (vCMs). A, Representative raw tracings of caffeine-induced Ca2+ transients (arrows indicate the time of caffeine application). B, Bar graphs summarizing the amplitudes of the same groups as indicated. Ad-PLB transductions significantly decreased the sarcoplasmic reticulum (SR) load (n=11, 11, 11, and 15 for control, Ad-GFP, Ad-PLB, and Ad-S16E-PLB, respectively). Untransduced vs Ad-S16E-PLB–tranduced: P=0.17. C, Representative raw tracings of electrically induced Ca2+ transients of untransduced, Ad-GFP–transduced, Ad-PLB–transduced, and Ad-S16E-PLB–transduced hES2-vCMs paced at 1 Hz. D–F, Bar graphs summarizing the transient parameters of the same groups from C. Ad-PLB transduction significantly decreased the transient amplitude (D) and prolonged the 50% decay (E) and upstroke (F). Ad-S16E-PLB transduction produced an intermediate phenotype (n=20, 17, 11, and 21 for control, Ad-GFP, Ad-PLB, and Ad-S16E-PLB. Untransduced vs Ad-S16E-PLB–tranduced: P=0.29 for upstroke time, P=0.14 for 50% decay time, and **P<0.01, compared with control. G and H, Representative ICa,L tracings of nontransduced and Ad-PLB–transduced hES2-vCMs. Electrophysiological protocol is given in the inset. Current density (I)–voltage (V) plots and steady-state activation curves revealed no significant differences. n=7 and 5 for control and Ad-PLB–transduced CMs, respectively.
