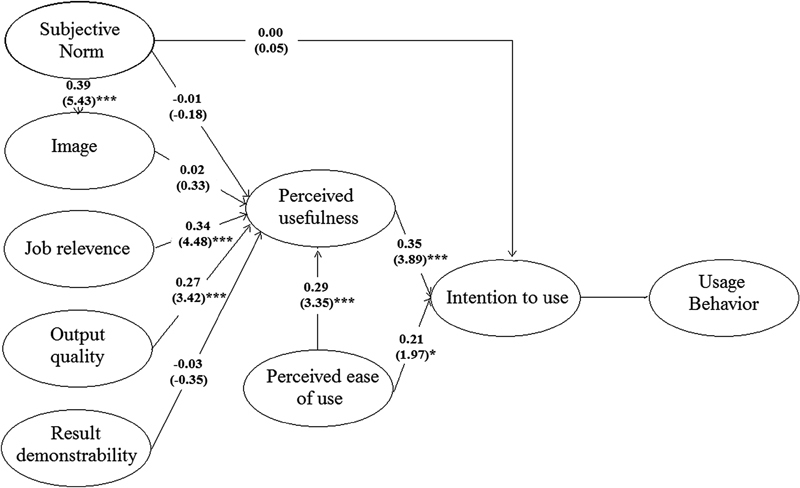
Fig. 3.

Path coefficients and relationships of the variables. The numerical figure is standardized parameter estimate, and the parenthesized value is t -value. *Denotes t -value > 1.96, p < 0.05; **Denotes t -value > 2.58, p < 0.01; ***Denotes t -value > 3.29, p < 0.001.
