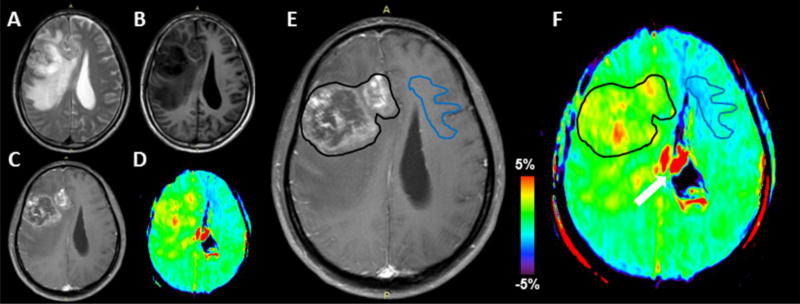
Fig. 1.
With reference to T2w (A), T1w (B), Gd-T1w (C), and APTw (D) images, an example of the placement of ROIs on the Gd-T1w image (E) and co-registered APTw image (F). One large ROI (black lines) contouring the whole area of Gd enhancement within the lesion on the Gd-T1w image was drawn and defined as the tumor mass. In addition, one ROI was placed in the CNAWM for normalization. The white arrow indicates artifacts associated with ventricles.

