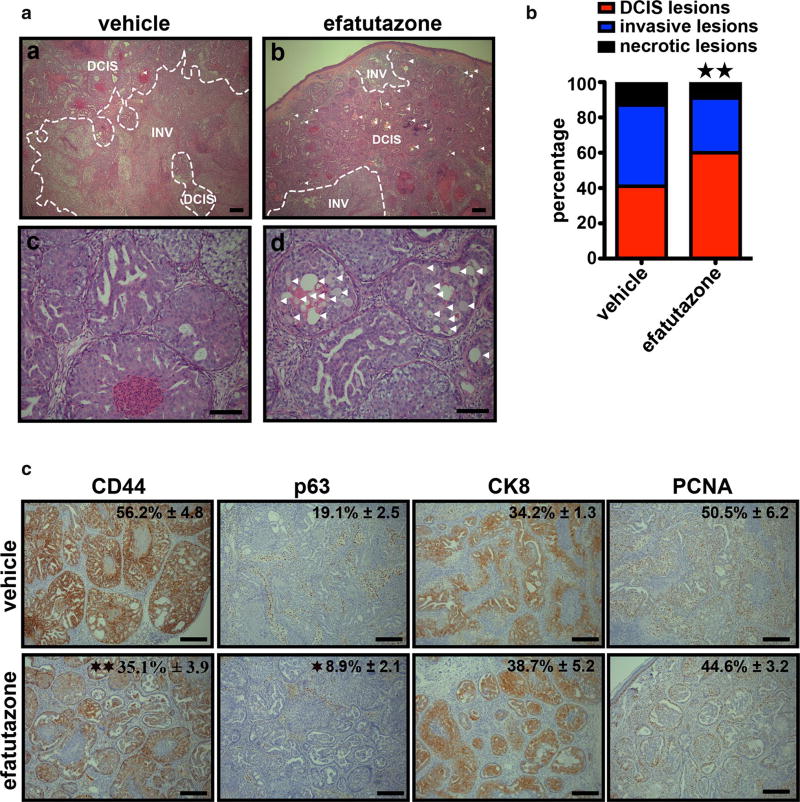
Fig. 4.
Efatutazone-treated DCIS lesions are less invasive with fewer CD44+/p63+ basal progenitor cells. a Representative hematoxylinand eosin-stained images of tissue sections from MCFDCIS xenograft tumors treated 3 weeks with vehicle or 30 mg/kg efatutazone. (a, b) DCIS DCIS lesions, INV invasive lesions. DCIS lesions containing lipid droplets are indicated by arrows. Scale bar = 200 µm. (c, d) Lipid droplets are indicated by arrows. Scale bar = 100 µm. b Percentage of DCIS, invasive, and necrotic lesions determined by microscopic area measurements using Fiji software. (χ2 test; n = 6; **p < 0.01 vs vehicle). c Representative IHC images of CD44, p63, CK8, and PCNA staining in xenografted tumor tissues obtained from MCFDCIS cells and treated with 30 mg/kg efatutazone (lower panel) or not (upper panel). The percentage of positive cells is indicated (upper right corner). Mean ± SEM (Student’s t test; n ≥ 4; *p < 0.05 vs vehicle; **p < 0.01 vs vehicle). Scale bar = 200 µm

