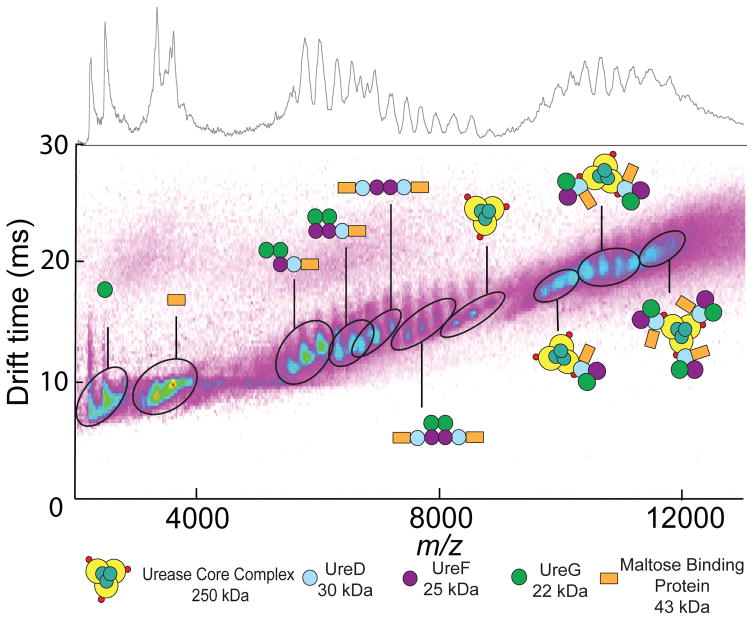
Figure 1. IM-MS analysis of (UreABC)3(MBP-UreDFG)3 and its subcomplexes.
IM-MS analysis of (UreABC)3(MBP-UreDFG)3 is presented as a plot of drift time vs m/z, with the standard m/z dimension projected on top of the figure. These data reveal the masses and collision cross sections of many subunits, and subcomplexes that comprise the 610 kDa (UreABC)3(MBP-UreDFG)3 octadecamer (Figure S2). IM-MS datasets for other urease-related subcomplexes can be found in Figure S3–S4

