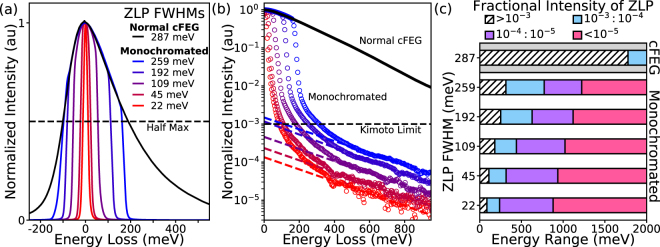
Figure 2.
Effect of Monochromation on ZLP tails. (a) ZLPs of a non-monochromated cFEG gun (black), and the same gun with several different levels of monochromation (increasing from blue to red), showing increased energy resolution and reduced ZLP tails. (b) Log plots for the ZLPs shown in (a), demonstrating that the intensity of the ZLP tail is reduced by several orders of magnitude by monochromation. The dashed line marks where the intensity of ZLP tail falls below 10−3 (also known as the Kimoto limit), indicating that the background is small enough for effective EELS analysis. Dashed lines are power-law fits to the ZLP tails at higher energies. (c) The energy ranges at which the ZLP is at specific fractions of its total intensity. The hatched white bars show the ranges where the ZLP tails are above the the 10−3 threshold, while the other bars show where the ranges where the background is below 10−3 (blue), 10−4 (purple), and 10−5 (pink) of the ZLP maximum intensity.

