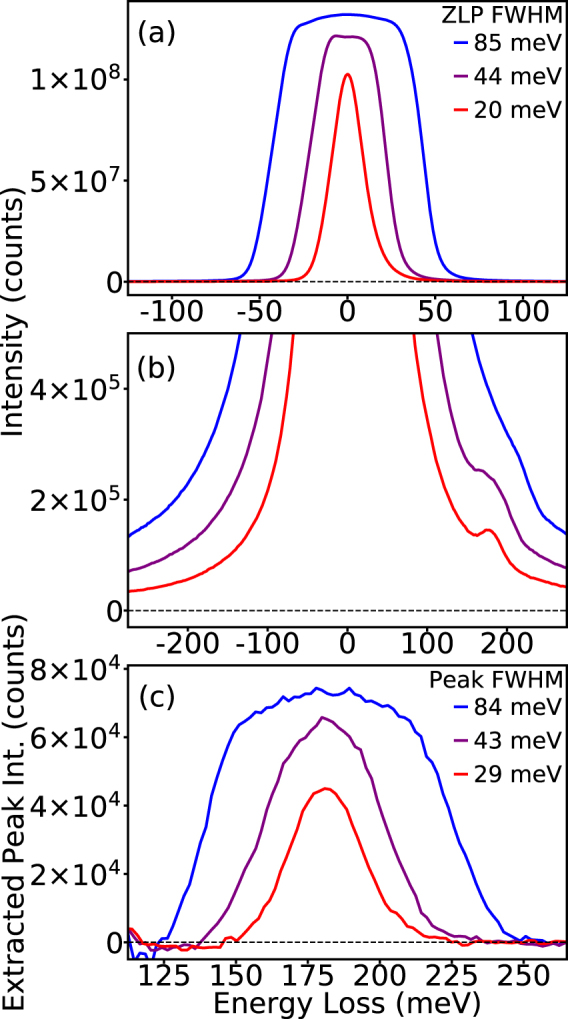
Figure 3.

Effect of monochromation on low energy-loss signals (<500 meV). (a) ZLPs at different levels of monochromation with FWHMs of 85 meV (blue), 44 meV (purple), and 20 meV (blue). (b) The EEL spectra are taken from h-BN nanoflakes in aloof configuration. The h-BN phonon peak is observed in all three spectra with increasing sharpness as the monochromation increases. (c) Same as (b) with an expanded scale, after background subtraction. The FWHM of the phonon peaks correspond to the FWHMs of the ZLPs except for the 20 meV FWHM spectrum, which has broadened to 30 meV, indicating that the width of the h-BN phonon mode being observed possesses a comparable line-width.
