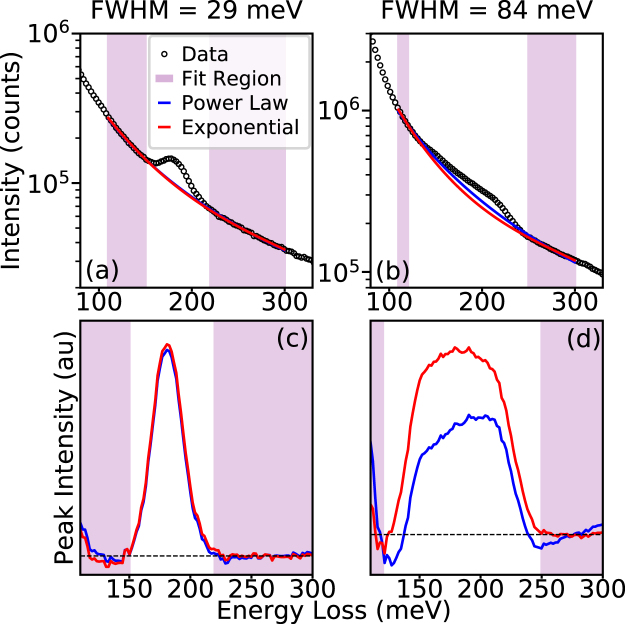
Figure 4.
Fitting peaks on monochromated ZLP tails. (a,b) Log plots of monochromated BN phonon peaks from Fig. 3 with peak FWHMs of 29 meV (a) and 84 meV (b). In each the background has been fit with a power law (blue) and a third order exponential (red). In (a) the two fits are almost identical and overlap, while in (b) a difference can be observed. (c,d) The extracted BN phonon peaks from the different backgrounds shown in (a) and (b). With a small FWHM (c) there is not a significant difference between the two backgrounds, but for the larger FWHM (d) the third order exponential provides a much more accurate fit.

