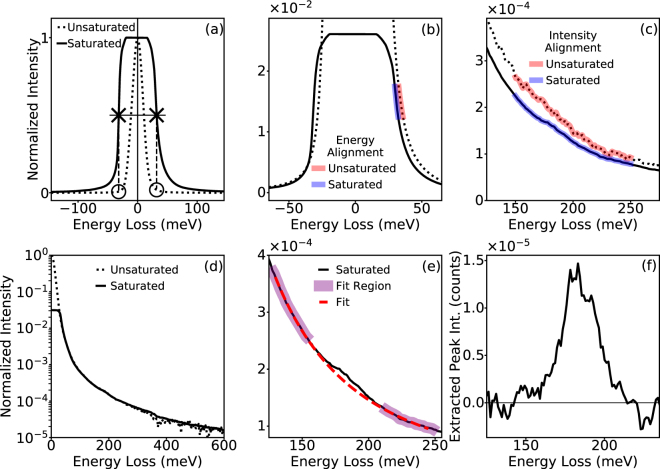
Figure 5.
Extracting weak signals from saturated ZLPs. (a) ZLPs of EEL spectra taken from h-BN nanoflakes in aloof configuration, far away from the BN (~1 μm). One is acquired with long dwell times to maximize signal, but results in a saturated ZLP (solid line), the other is acquired with shorter dwell times to preserve the unsaturated ZLP (dashed). In order to calibrate and normalize the saturated spectrum it is aligned to the unsaturated ZLP. A rough alignment by centering the FWHM of the saturated peak on the true zero loss of the unsaturated peak, and then scaling the saturated spectrum by average intensity of the half maxes of the saturated spectrum (Xs) with the average intensities of the unsaturated spectrum at the same energy losses (Os). (b) Precise energy alignment is performed by taking a range of intensities from the unsaturated and saturated spectra (red and blue, respectively), and adjusting the energy loss axis of the saturated spectrum so the average energies in that range match. (c) Precise intensity alignment done similarly, by matching the average intensity in a specific energy range. (d) Result is a calibrated normalized spectrum with a saturated ZLP. (e) Background fitting shows observable BN phonon peak in saturated spectrum. (f) Extracted aloof BN phonon peak with intensity 5 orders of magnitude less than the ZLP maximum.

