Figure 3.
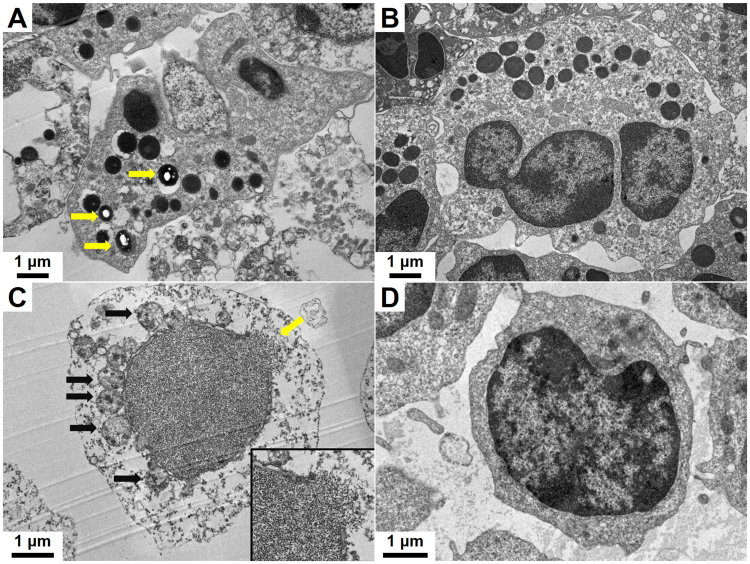
C-AgNP20 induced different cytomorphological alterations and intracellular distributions in cPMNs and cPBMCs. Representative TEM images of ultrathin sections of cPMNs after 4 h of culture (A) with 50 μg/ml C-AgNP20 and (B) without C-AgNP20 (control). Intracellular electron-dense structures with clear spaces are indicated by yellow arrows. Representative TEM images of ultrathin sections of cPBMCs after 4 h of culture (C) with 50 μg/ml C-AgNP20 and (D) without C-AgNP20 (control). Ruptured nuclear membrane is indicated by yellow arrow, and black arrows indicate the swollen mitochondria with cristae disruption. Inset: higher power field of the ruptured nuclear membrane.

