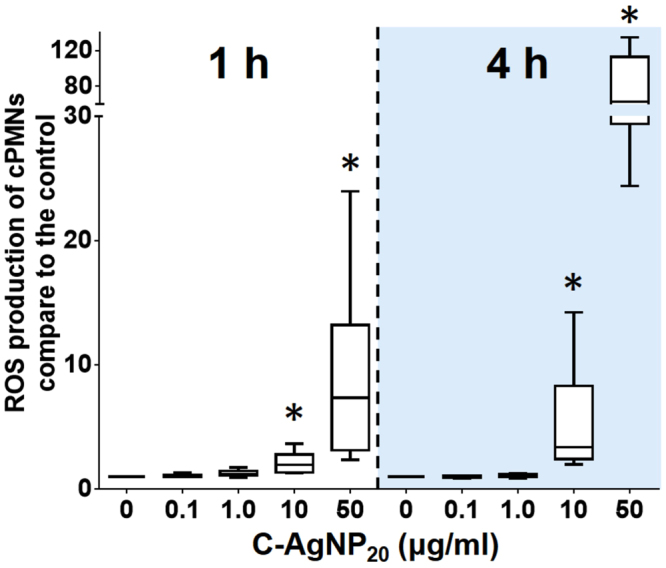
Figure 8.

The ROS production of cPMNs induced by C-AgNP20. The bar in the middle of the box represents the median, and the bottom and top of the box describe the first and third quartiles. The whiskers show the 75th percentile plus 1.5 times IQR and 25th percentile minus 1.5 times IQR of all data, and any values greater than these are defined as outliers and plotted as individual points. Asterisks indicate statistically significant differences from the control (p < 0.05, Kruskal-Wallis Test).
