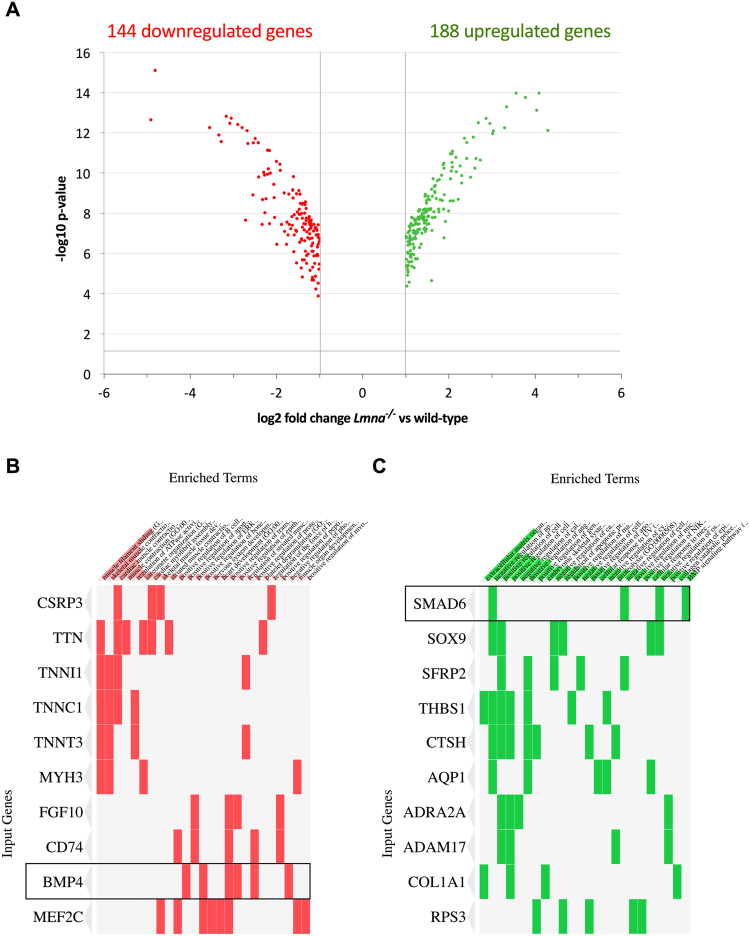
Figure 1.
Transcriptomic analysis of Lmna−/− versus wild-type H-2K myoblasts expression profiles. (A) Volcano plot displaying the repartition of up- and down-regulated genes in Lmna−/− H-2K myoblasts compared to wild-type. Only the genes with a p-value inferior to 0.05 (−log10 p-value superior to 1.3) and at least a twofold change (log2 fold-change superior to 1) are displayed. (B,C) Clustergramm listing downregulated (B) and upregulated (C) genes were generated using ENRICHR (http://amp.pharm.mssm.edu/Enrichr/) to identify misregulated genes of interest in enriched GO Biological Process 2017 categories.

