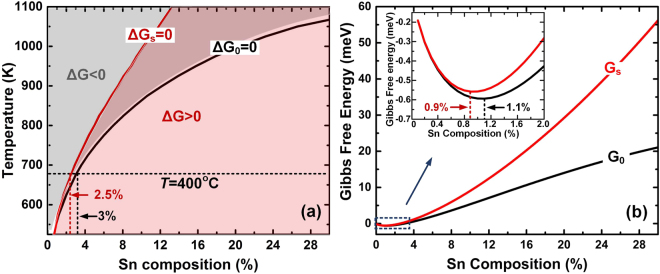
Figure 5.
(a) Plots of Gibbs free energy ΔG0 = 0 and ΔGs = 0 correspond to the stability boundary of fully relaxed and compressively strained GeSn system, respectively. The grey and purple zone marked in the plots represent the stable (ΔG > 0) and unstable (ΔG > 0) region. Under compressive strain, stability boundary (ΔGs = 0) shifts to lower Sn composition, shrinking the stable region. At T = 400 °C, the maximum Sn composition for strained and unstrained system is 2.5% and 3%, respectively. (b) Gibbs free energy plot at T = 400 °C with (Gs) and without strain (G0). The local minimum Sn contents for strained system and unstrained system occur at 0.9% and 1.1%, respectively.

