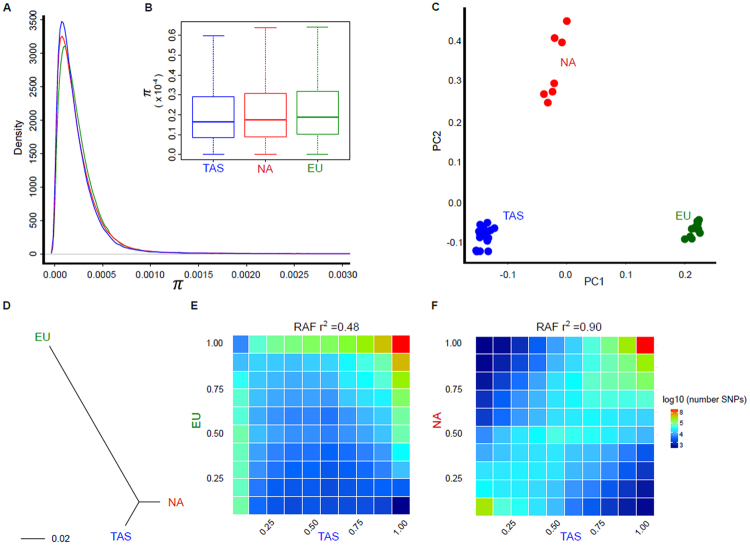
Figure 1.
Population diversity and divergence. (A) Nucleotide diversity was estimated in 20 Kb genomic intervals for the TAS, EU and NA populations. (B) Following subsampling of the TAS data to match the read depth available for North American (NA) and European (EU) salmon genomes (S2 Fig), nucleotide diversity is shown as a box and whisker plot. (C–F). Three methods illustrate the divergence between populations. First, PCA of genetic distance (C) was performed to assess the clustering of animals, coloured according to their population. Next, pairwise population FST was used to construct a dendogram linking the populations (D). Finally, Reference allele frequency (RAF) bins were estimated within each population, before being compared between populations and visualised as heatmaps. SNP displaying low RAF in one population and high RAF in second are located at the top left and bottom right of the heatmap. Conversely, SNP with highly correlated RAF are located on the axis joining the bottom left and top right. Increasing SNP count is indicated using increasingly warm color. The correlation of RAF for the TAS and EU (E), and TAS and NA (F) is given above each heatmap.

