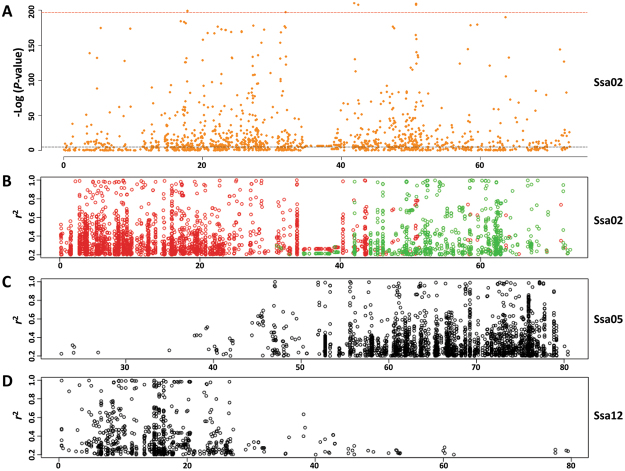
Figure 3.
Non-syntenic linkage disequilibrium. Non-syntenic linkage disequilibrium corresponds with the genomic location of homeologous chromosome segments. (A) SNP associations to GSEX spanning Ssa02 are shown, along with the chromosome specific threshold defining the top 0.5% of SNP ranked on P-value. Marker locations are given as Mb and the data is a subset of that displayed in Fig. 2. Highly associated loci are located throughout, with the exception of the centromeric region spanning Mb 34–38. (B–D) Linkage disequilibrium for SNP pairs located on different chromosomes (non-syntenic). (B) SNP positioned on Ssa02 are shown that display elevated LD (r2 > 0.2) with loci on either Ssa05 (red) or Ssa12 (green). Note that only SNP with r2 > 0.2 are shown and the scale does not extend to zero. The location of SNP pairs with elevated non-syntenic LD aligns with the known homeologous chromosomal segments, as graphically depicted in Fig. 2. For example, the 2p end of Ssa02 (Mb 0–30) displays high LD with Ssa05 (Mb 50–80) while 2q (Mb 50–80) displays extensive LD with loci spanning Ssa12 (Mb 0–30). (c) SNP positioned on Ssa05 are shown with r2 > 0.2 with loci on Ssa02. (D) SNP positioned on Ssa12 are shown with r2 > 0.2 with loci on Ssa02.

