Figure 7.
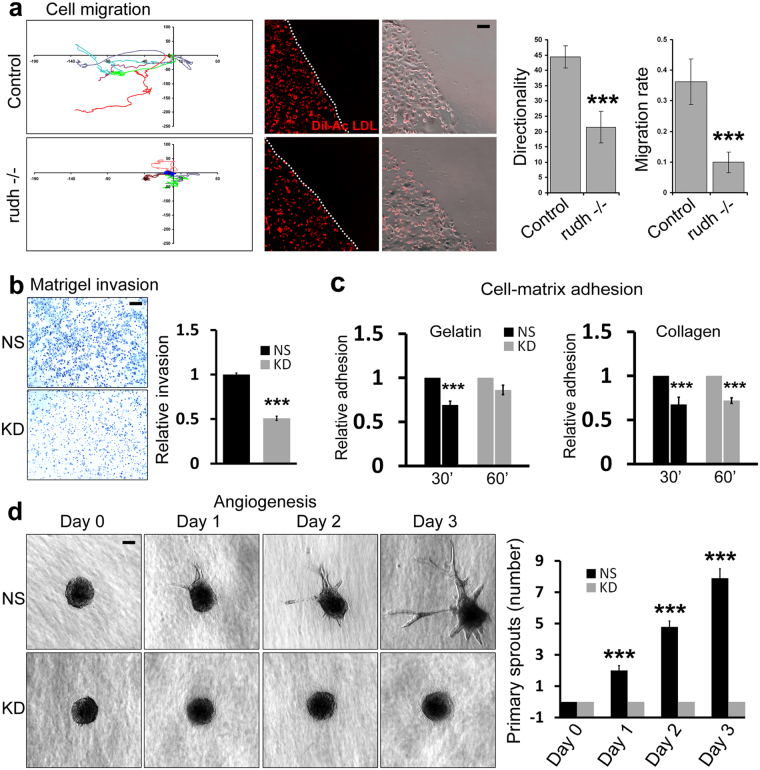
Rudhira is essential for sprouting angiogenesis. (a) Migration tracks of control and rudh−/− yolk sac endothelial cells subjected to wounding assay. Quantification showing the rate of migration and directionality compared between control and rudh−/− yolk sac endothelial cells (marked by DiI-Acetylated LDL). Dotted line indicates the wound margin. Error bar indicates mean ± SD of a total of 14 cells. (b) NS and KD SVEC cells were tested for invasion using a Matrigel transwell-invasion assay. Graph indicates the relative invasion of cells 24 h post seeding as measured by Crystal Violet absorbance at 590 nm (c) NS or KD ECs were compared for adherence when plated on gelatin or collagen. Graphs indicate the relative adhesion of cells in 30 and 60 min post seeding as measured by Crystal Violet absorbance at 550 nm. (d) Collagen-based spheroid sprouting assay with spheroids formed from non-silencing (NS) and rudhira shRNA (KD) SVEC lines. Graph shows quantitation of the number of primary sprouts over time in days. Error bars indicate standard error of mean (SEM). Results shown are a representative of at least three independent experiments with at least three biological replicates. Statistical analysis was carried out using one-way ANOVA. Scale bar: (a,b,d) 100 μm. *p < 0.05, **p < 0.01, ***p < 0.001.

