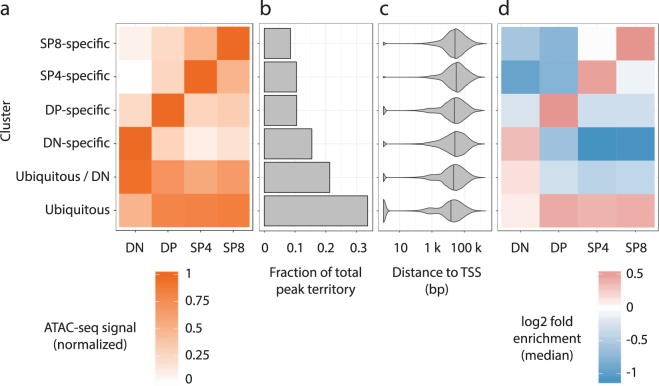
Figure 1.
Analysis of stage-specific and ubiquitous ATAC-seq clusters. (a) k-means clustering results for the ATAC-seq signal in the four samples. Colors indicate the mean ATAC-seq signal for each sample in the respective cluster (i.e. the cluster centers). (b) Fraction of total peaks territory covered by each of the clusters. (c) TSS distance distribution (in log10 scale) for each of the clusters. Vertical bars in the violin plots correspond to the median of the dataset. (d) Median GAT footprint enrichment of all motifs for each dataset in the k-means clusters. GAT footprint enrichment heatmaps for each motif are shown in Supplementary Fig. S7.

