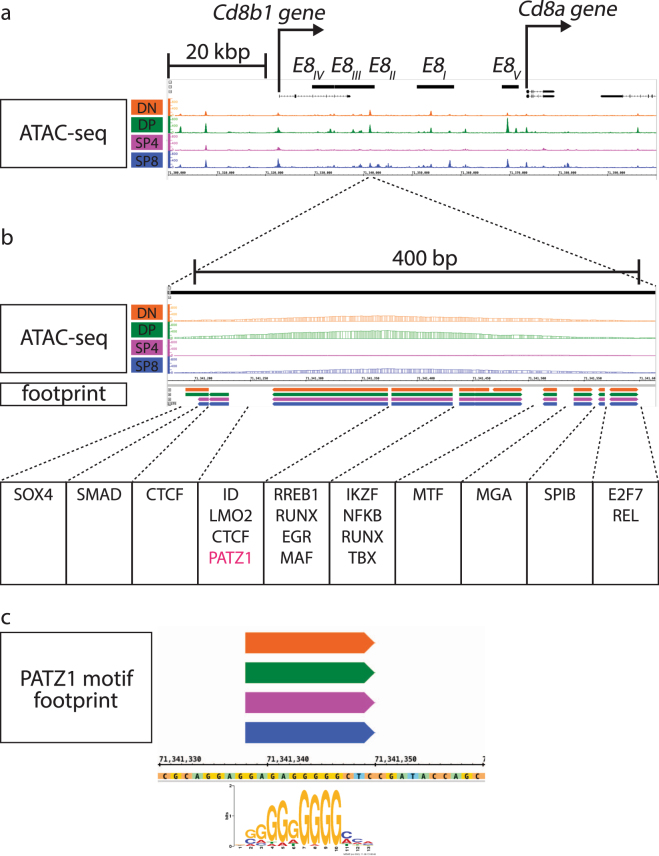
Figure 3.
ATAC-seq signal and footprint calls within functionally validated enhancers for the Cd8 gene. (a) ATAC-seq signals are shown on the IGB browser within around 100 kbp of the Cd8 locus; mm10, chr6:71,300,001-71,400,000. The positions of the E8I - E8V enhancers43–45 are depicted at the top (b) ATAC signals and footprint calls at an ATAC peak identified in E8II are shown. (c) A PATZ1 motif footprint within E8II is shown. Footprint calls within E8I and E8V are shown in Supplementary Fig. S9.

