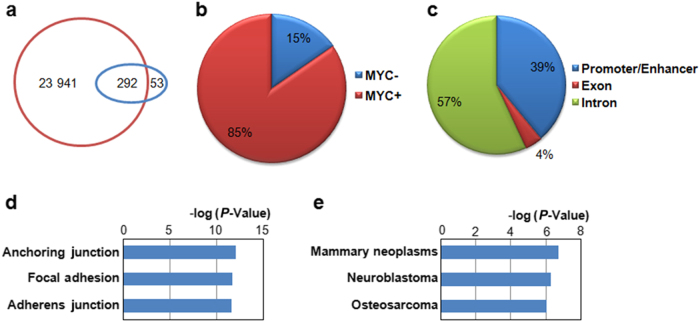
Fig. 2.
MYC regulates super enhancer genes in osteosarcoma. a Overlap between MYC binding sites and super enhancer regions in U2OS cells. Brown circle represents the size of MYC target; blue circle represents the size of super enhancers. b Groups of super enhancer regions based on MYC binding status. The super enhancers were separated into two different groups based on their MYC binding statuses. c Distribution of MYC bound super enhancers in different genomic regions. d, e Gene ontology analysis of MYC bound super enhancer associated genes. d Cellular component gene ontology; e disease gene ontology (color figure online).

