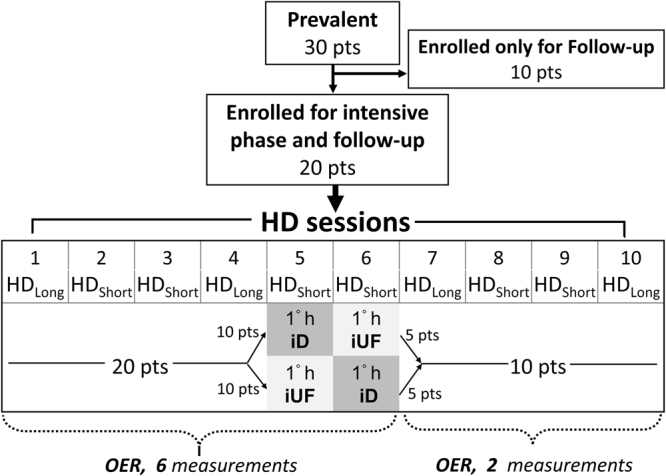
Figure 1.

Flow chart of the study. 20 patients were enrolled for the intensive phase of the study which lasted for ten consecutive hemodialysis sessions. In every subject, OER was measured six times during each of the first 6 HD sessions, while in dialysis sessions 7 to 10 OER was measured only twice, in ten patients only. Ten further patients were enrolled for the clinical follow-up phase. HDLong = Hemodialysis following long interdialytic interval; HDShort = Hemodialysis following short interdialytic interval; iD = isolated dialysis; iUF = isolated ultrafiltration.
