
Figure 7.
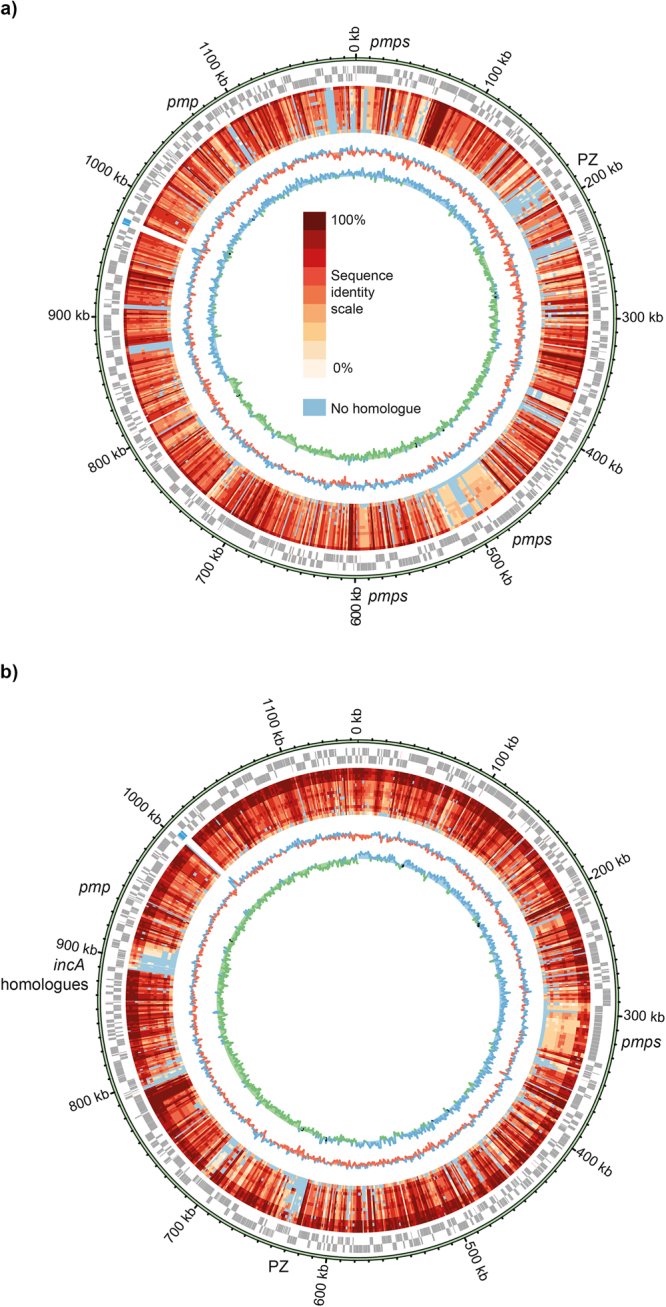
Circular representation of the chromosomes illustrating protein sequence conservation compared with other representatives of the Chlamydiaceae. The predicted CDSs are shown on the outer circle in forward or reverse frames. rRNA genes are shown in blue. The inner circles represent identities of the closest orthologue of each CDS identified using Orthofinder, compared against reference genomes. The genomes are ordered based on average sequence identity (see key) as below. Regions showing lower conservation are indicated. (a) C. serpentis H15-1957-10C: C. pneumoniae CWL029, C. poikilothermis. 834 K, C. psittaci 6BC, C. felis Fe/C-56, C. caviae GPIC, Ca. C. sanzinia 2742-308, C. abortus S26/3, C. pecorum E58, C. gallinacea 08–1274/3, Ca. C. ibidis 10–1398/6, C. muridarum Nigg, C. trachomatis D/UW-3/CX, C. avium 10DC88, C. suis MD56, Waddlia chondrophila WSU 86-1044. (b) C. poikilothermis S15-834K: C. psittaci 6BC, C. caviae GPIC, C. felis Fe/C-56, C. abortus S26/3, C. serpentis 10 C, C. pneumoniae CWL029, Ca. C. sanzinia 2742-308, C. gallinacea 08-1274/3, Ca. C. ibidis 10-1398/6, C. pecorum E58, C. muridarum Nigg, C. trachomatis D/UW-3/CX, C. avium 10DC88, C. suis MD56, Waddlia chondrophila WSU 86-1044. The two inner plots indicates the G + C content (blue for above average and red for below average) and G + C skew (blue for positive and green for negative).