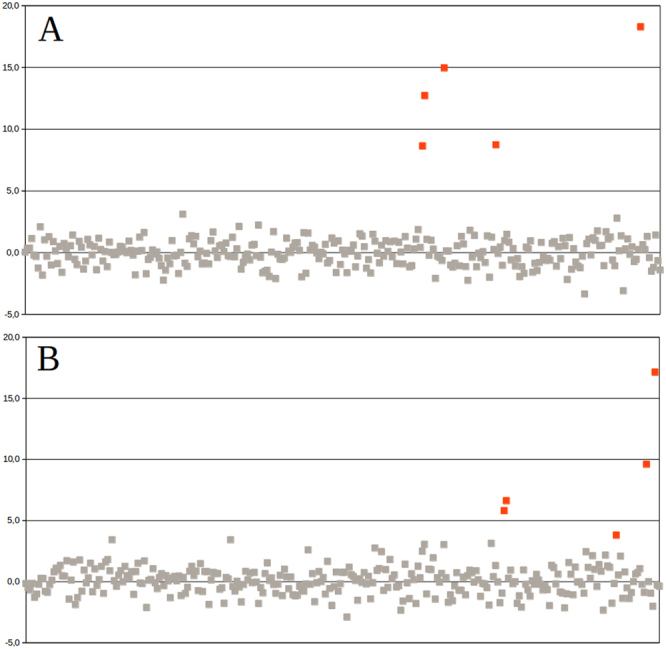
Figure 2.

NIPTmer results for 294 subjects of Estonian cohort collected from Tartu University Hospital. Chromosome 21 (A) and chromosome 18 (B). Samples are ordered on the x-axis by the order of subject enrollment. The y-axis represents the standardized deviation (z-score) between the predicted and observed coverage of a given chromosome. Euploid samples are represented by gray points and aneuploid samples by red points. If we apply the cut-off line at 3.5 SD, all five T21, four T18 samples and one mosaic T18 case (z-score = 3.8) are recognized.
