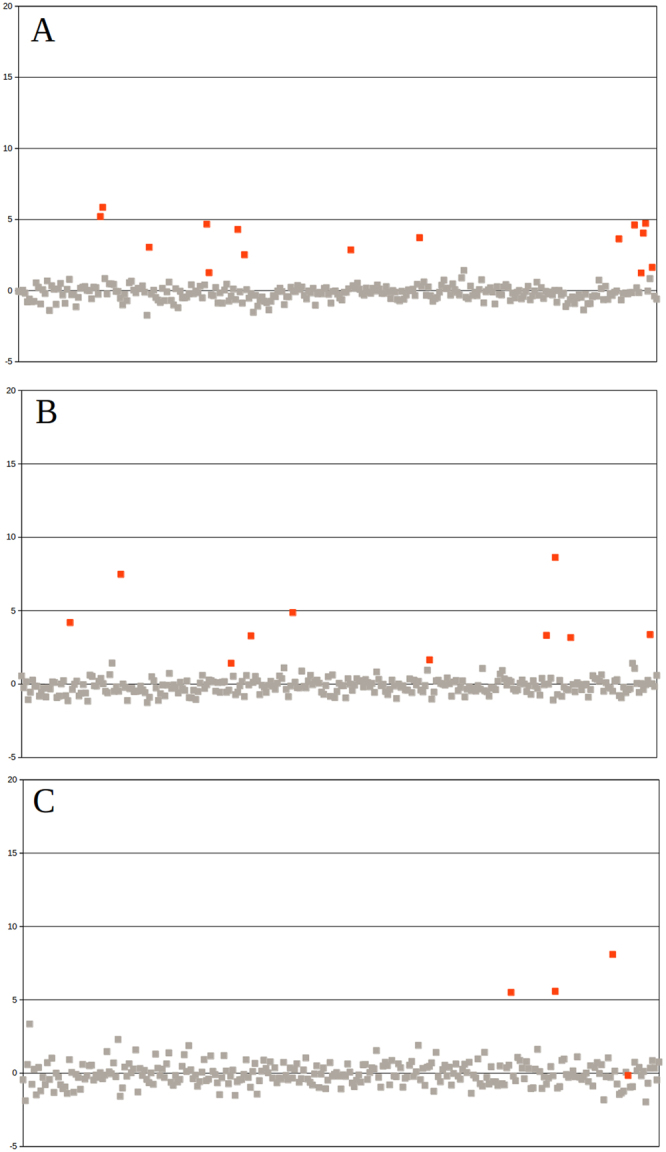
Figure 3.

NIPTmer results for 289 subjects of Belgian cohort. Chromosome 21 (A), chromosome 18 (B) and chromosome 13 (C). Samples are ordered on the x-axis by the order of subject enrollment. The y-axis represents the standardized deviation (z-score) between the predicted and observed coverage of given chromosome. Euploid samples are represented by gray points and aneuploidy samples by red points. All non-mosaic aneuploidies, including T21 (15/15), T18 (10/10), and T13 (3/3), had higher z-scores than the highest control score, although the difference between lowest trisomy and highest normal score was small for trisomies 18 and 21. Unfortunately, we could not detect one mosaic T13 with our pipeline.
