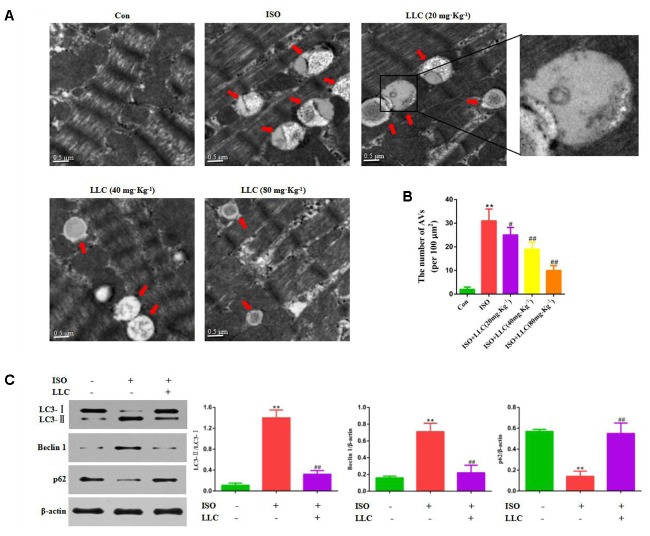
FIGURE 4.
Effects of LLC on autophagy in the hearts from rats subjected to myocardial ischemia injury. (A) Representative transmission electron ultra-images showing autophagic vacuoles (marked with red arrows in the images, scale bar = 0.5 μm). (B) Quantitative analysis of the number of autophagic vacuoles in (A). (C) Expression levels of LC3, Beclin 1 and p62 changes with LLC (80 mg⋅Kg-1) pretreatment. Data were presented as means ± SD. ∗∗P < 0.01 vs. Con group, #P < 0.05, ##P < 0.01 vs. ISO group.

