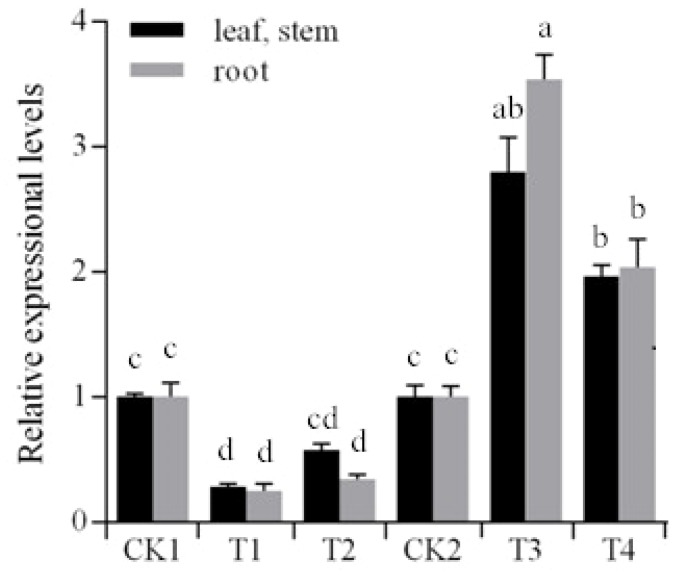
FIGURE 3.
Expressional levels of StNAC262 gene between the transgenic and non-transgenic potato plants. CK1: non-transgenic potato “Gannongshu 2” as negative control; T1–T2: the transgenic potato plant transformed with the vector pCPB121-miR164; CK2: non-transgenic potato “Kexin 3” as negative control; T3–T4: the transgenic potato plant transformed with the vector pCPB-NAC262. Data presented as a mean ± SD (three biological replicates), different letters above the columns indicate significant differences at p ≤ 0.05 levels with corresponding CK.

