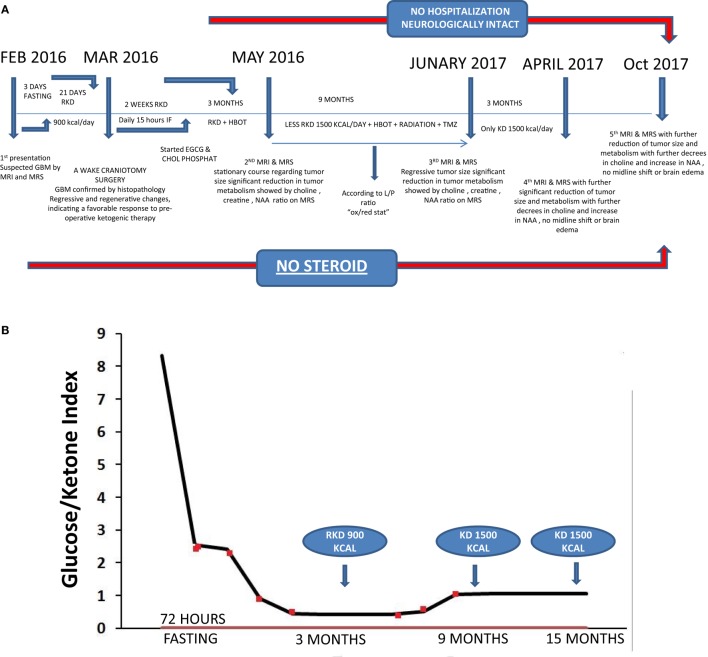
Figure 1.
(A) Timeline of clinical course with dates of dietary treatments, magnetic resonance imaging (MRI), magnetic resonance spectroscopy (MRS), and hyperbaric oxygen therapy (HBOT). (B) Glucose/ketone index indicates the ratio of circulating glucose to urinary ketones at all eight clinical assessments during the 15 months period from February 2016 to April 2017.

