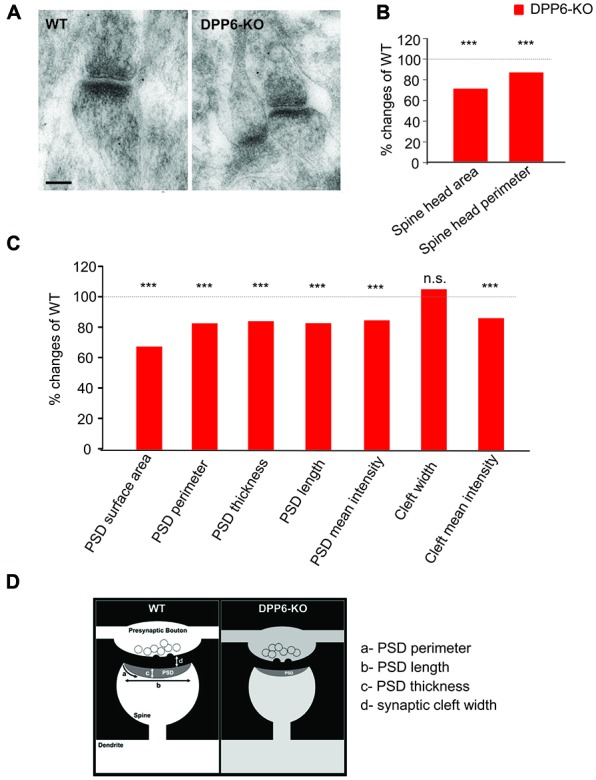
Figure 6.

DPP6 mice have developmental deficits in synaptic structures of the hippocampal CA1 Region. (A) Representative images of electron micrographs showing the synaptic contacts with presynaptic vesicles, and postsynaptic densities in dendritic spines in the CA1 region of the WT (left) and DPP6-KO (right) hippocampus. Scale bar is 100 nm. (B) Measurement of dendritic spine head size. The spine head area and perimeter are reduced 30% and 15% in DPP6-KO mice relative to WT as 100%. Student’s t-test, p < 0.001. (C) Summary of postsynaptic density measurements. (D) Schematic drawing showing a synaptic contact with presynaptic vesicles and a postsynaptic density in a dendritic spine. Approximate measured relative dimensions are displayed to compare DPP6-KO with WT (n.s. = not significant, ***p < 0.001).
