Figure 3.
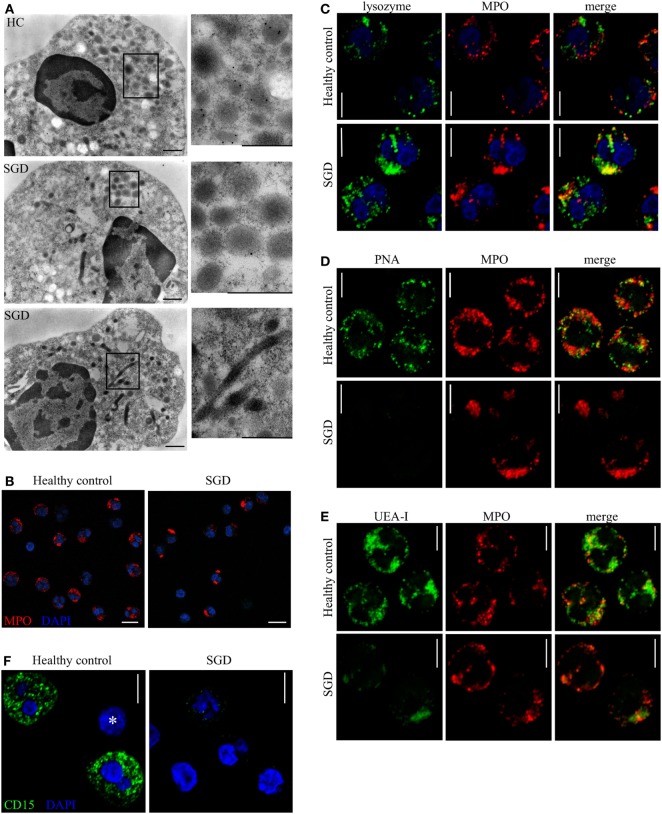
Granule distribution, protein content, and glycosylation pattern of neutrophil granules are modified in specific granule deficiency (SGD). (A) Immunoelectron microscopy shows presence of lactoferrin (15 nm gold particles) in secondary granules in healthy controls (HCs, upper panel) and its absence in two SGD patients (two lower panels). Elongated sacs as well as aggregates of granules are observed in SGD but not in HCs (see zoomed in panels). Scale bars: 500 nm. (B) MPO-containing granules (red) are aggregated and polarized in SGD compared with HCs as shown by confocal immunofluorescence. Scale bar: 10 µm. (C) Lysozyme (green) co-localizes with MPO (red) in neutrophils of SGD patients (lower panel) but not of HCs (upper panel). (D,E) Different populations of granules are recognized specifically by the lectins (green) peanut agglutinin (PNA) (D) and UEA-I (E) in HCs (upper panel), displaying, respectively, no or partial co-localization with MPO (red). The granules in SGD neutrophils (lower panel) are not recognized by PNA (D) and react weakly with Ulex europaeus agglutinin I (UEA-I) (E) compared with HCs. (F) The anti-CD15 (green) staining is reduced in neutrophils of SGD patients (right) compared with healthy donor (left). No staining is visible in a lymphocyte in the healthy donor (asterisk). Scale bars (C–F): 5 µm.

