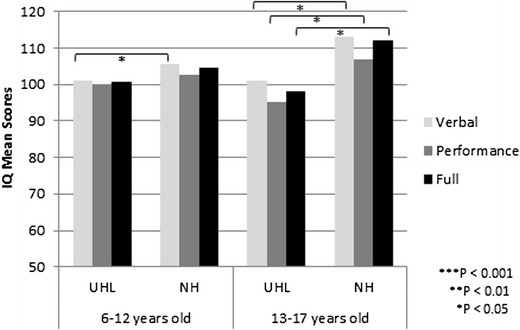
Fig. 2.

Differences in standardized intelligence quotient scores from childhood to adolescents. Children with UHL are compared to their siblings with NH. The effect sizes of the differences in scores appear to enlarge from 0.2–0.3 SD in elementary school (small effect) to 0.8–0.9 SD in adolescents (large effect)
