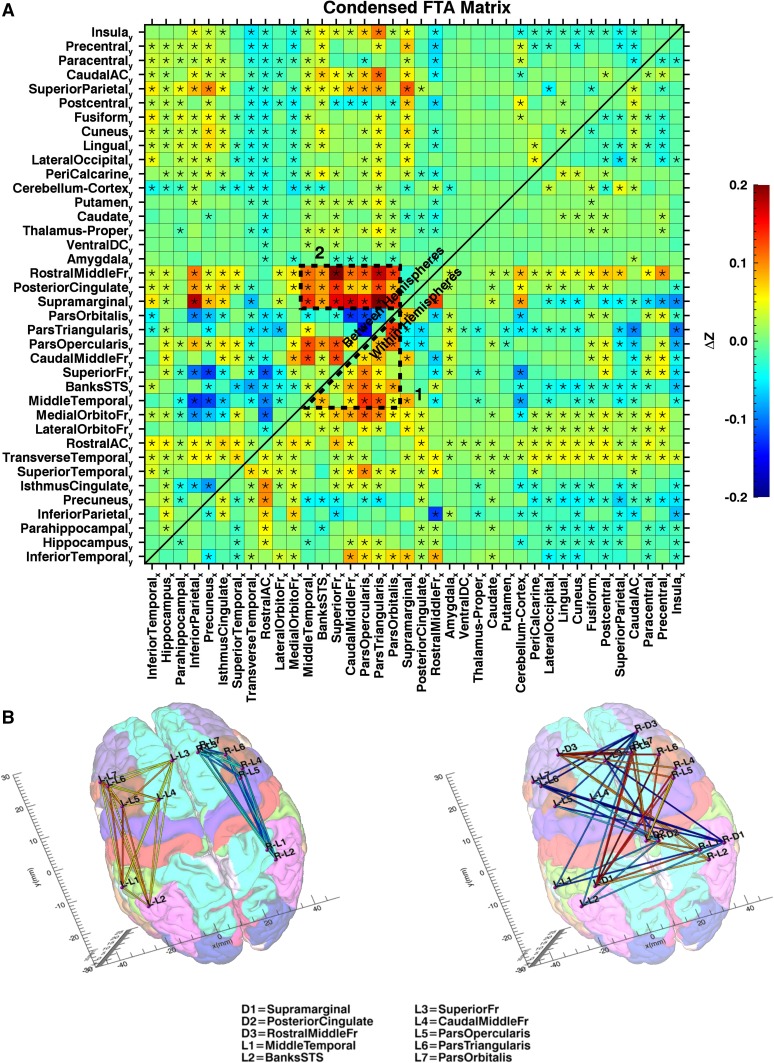
Fig. 5.
a Mean AFC for the connections between the different ROIs. Colors indicate the mean differences in z values between the original and mirror matrix. Asterisks designate asymmetries significantly different from 0 (p < 0.05; Bonferroni corrected). The lower right portion of the matrix shows asymmetry of within-hemisphere connections, meaning the connectivity between left areax and left areay, minus the connectivity between right areax and right areay. The top left portion of the matrix shows asymmetry of between-hemisphere connections, meaning the connectivity between left areax and right areay, minus the connectivity between left areay and right areax. The sequence of ROIs along the x and y axes was adjusted, so that ROIs with similar patterns of asymmetry are clustered together. Two clusters containing a large portion of the most pronounced asymmetries are delineated by an intermittent line. b Connectivity diagram representing the two clusters with the most pronounced AFC. Tags for the different brain areas are explained directly below the diagram. Colored lines between the ROIs indicate the strength of the asymmetry (original minus mirrored), with color coding according to the legend of a. The left image (1) shows the within-hemisphere asymmetry in connectivity between language areas; the right image (2) shows the between-hemisphere asymmetry in connectivity between language areas and the default mode network

