
Figure 2.
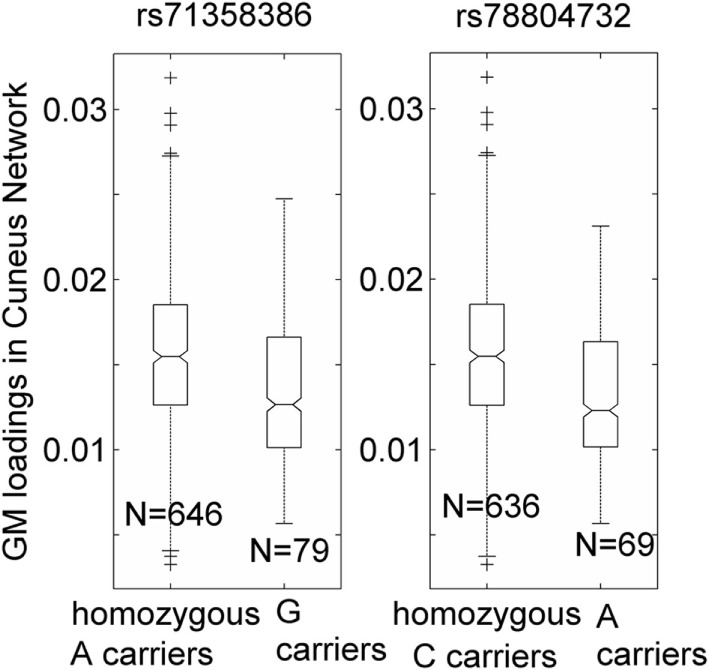
Association of two single-nucleotide polymorphisms, rs71358386 and rs78804732, with a cuneus gray matter (GM) component. GM loadings are relative values without unit. In the box plots, the middle line is the median value, the top and bottom of each box are the 25th and 75th percentile values, the whiskers extend from the ends of the interquartile to the further values within 1.5 times the interquartile, and plus (+) signs show values that are more than 1.5 times the interquartile range away from the top or bottom of the box. The plot of medium and 25/75th percentile presents a similar overall pattern as the mean and standard deviation in these data.