FIGURE 1.

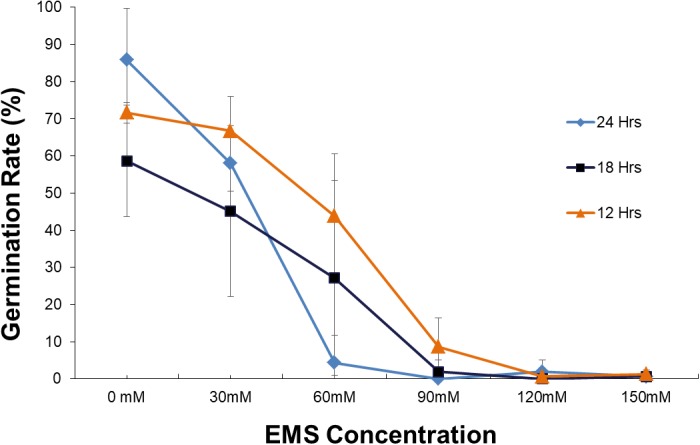
Plot of germination rate for various EMS concentrations (mM) and soaking time. Error bar represents the standard deviation of three replicates.

Plot of germination rate for various EMS concentrations (mM) and soaking time. Error bar represents the standard deviation of three replicates.