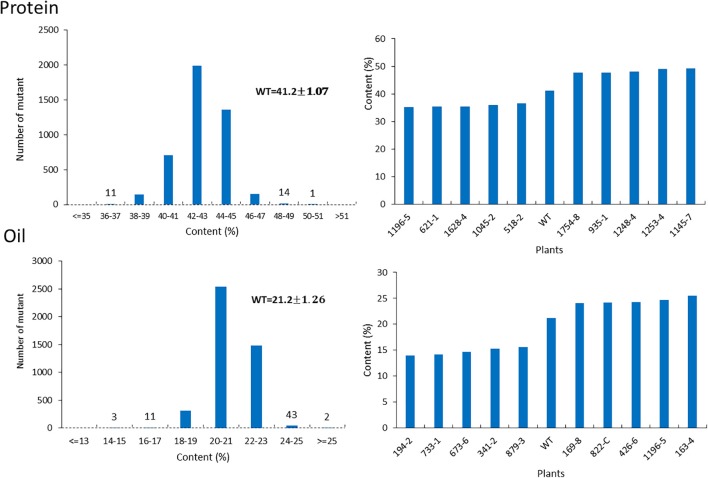
FIGURE 7.
Protein and oil content in mutant seeds. Histograms (left) indicate variations in protein and oil content present in the population. Bold type indicates the average of protein and oil content in wild-type plants. Bar graphs (right) represent the protein and oil content values for average wild-type JTN-5203, top five and bottom five.

