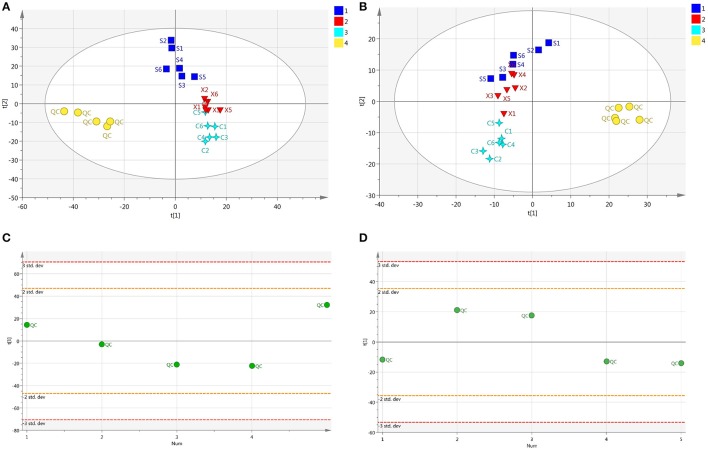
Figure 2.
(A) The PCA plot of QC and samples in positive ion mode, (B) The PCA plot of QC and samples in negative ion mode, (C) The scatter distribution plot in the first principal components in positive ion mode, (D) The scatter distribution plot in the first principal components in negative ion mode.

