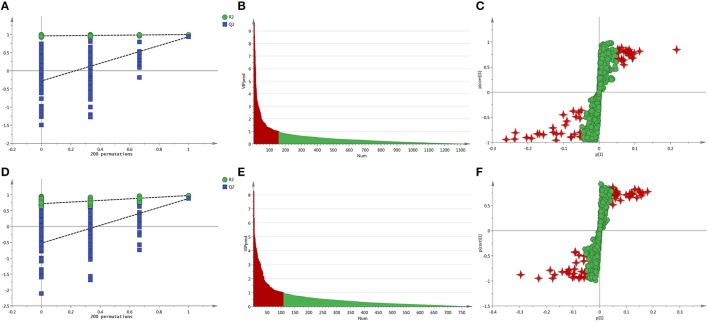
Figure 4.
(A) The permutations test of the C vs. S group in positive ion mode, (B) The VIP plot of the C vs. S group in positive ion mode, (C) The S-plot of the C vs. S group in positive ion mode, (D) The permutations test of the C vs. S group in negative ion mode, (E) The VIP plot of the C vs. S group in negative ion mode, (F) The S-plot of the C vs. S group in negative ion mode.

